Predictions on Real World Panoramas
We collect real-world panorama of indoor environments to visualize the model's predictions. We focus on sim-to-real performance of the audio prediction, as once accurately estimated, these values can be weighted against distance for audio-informed planners.
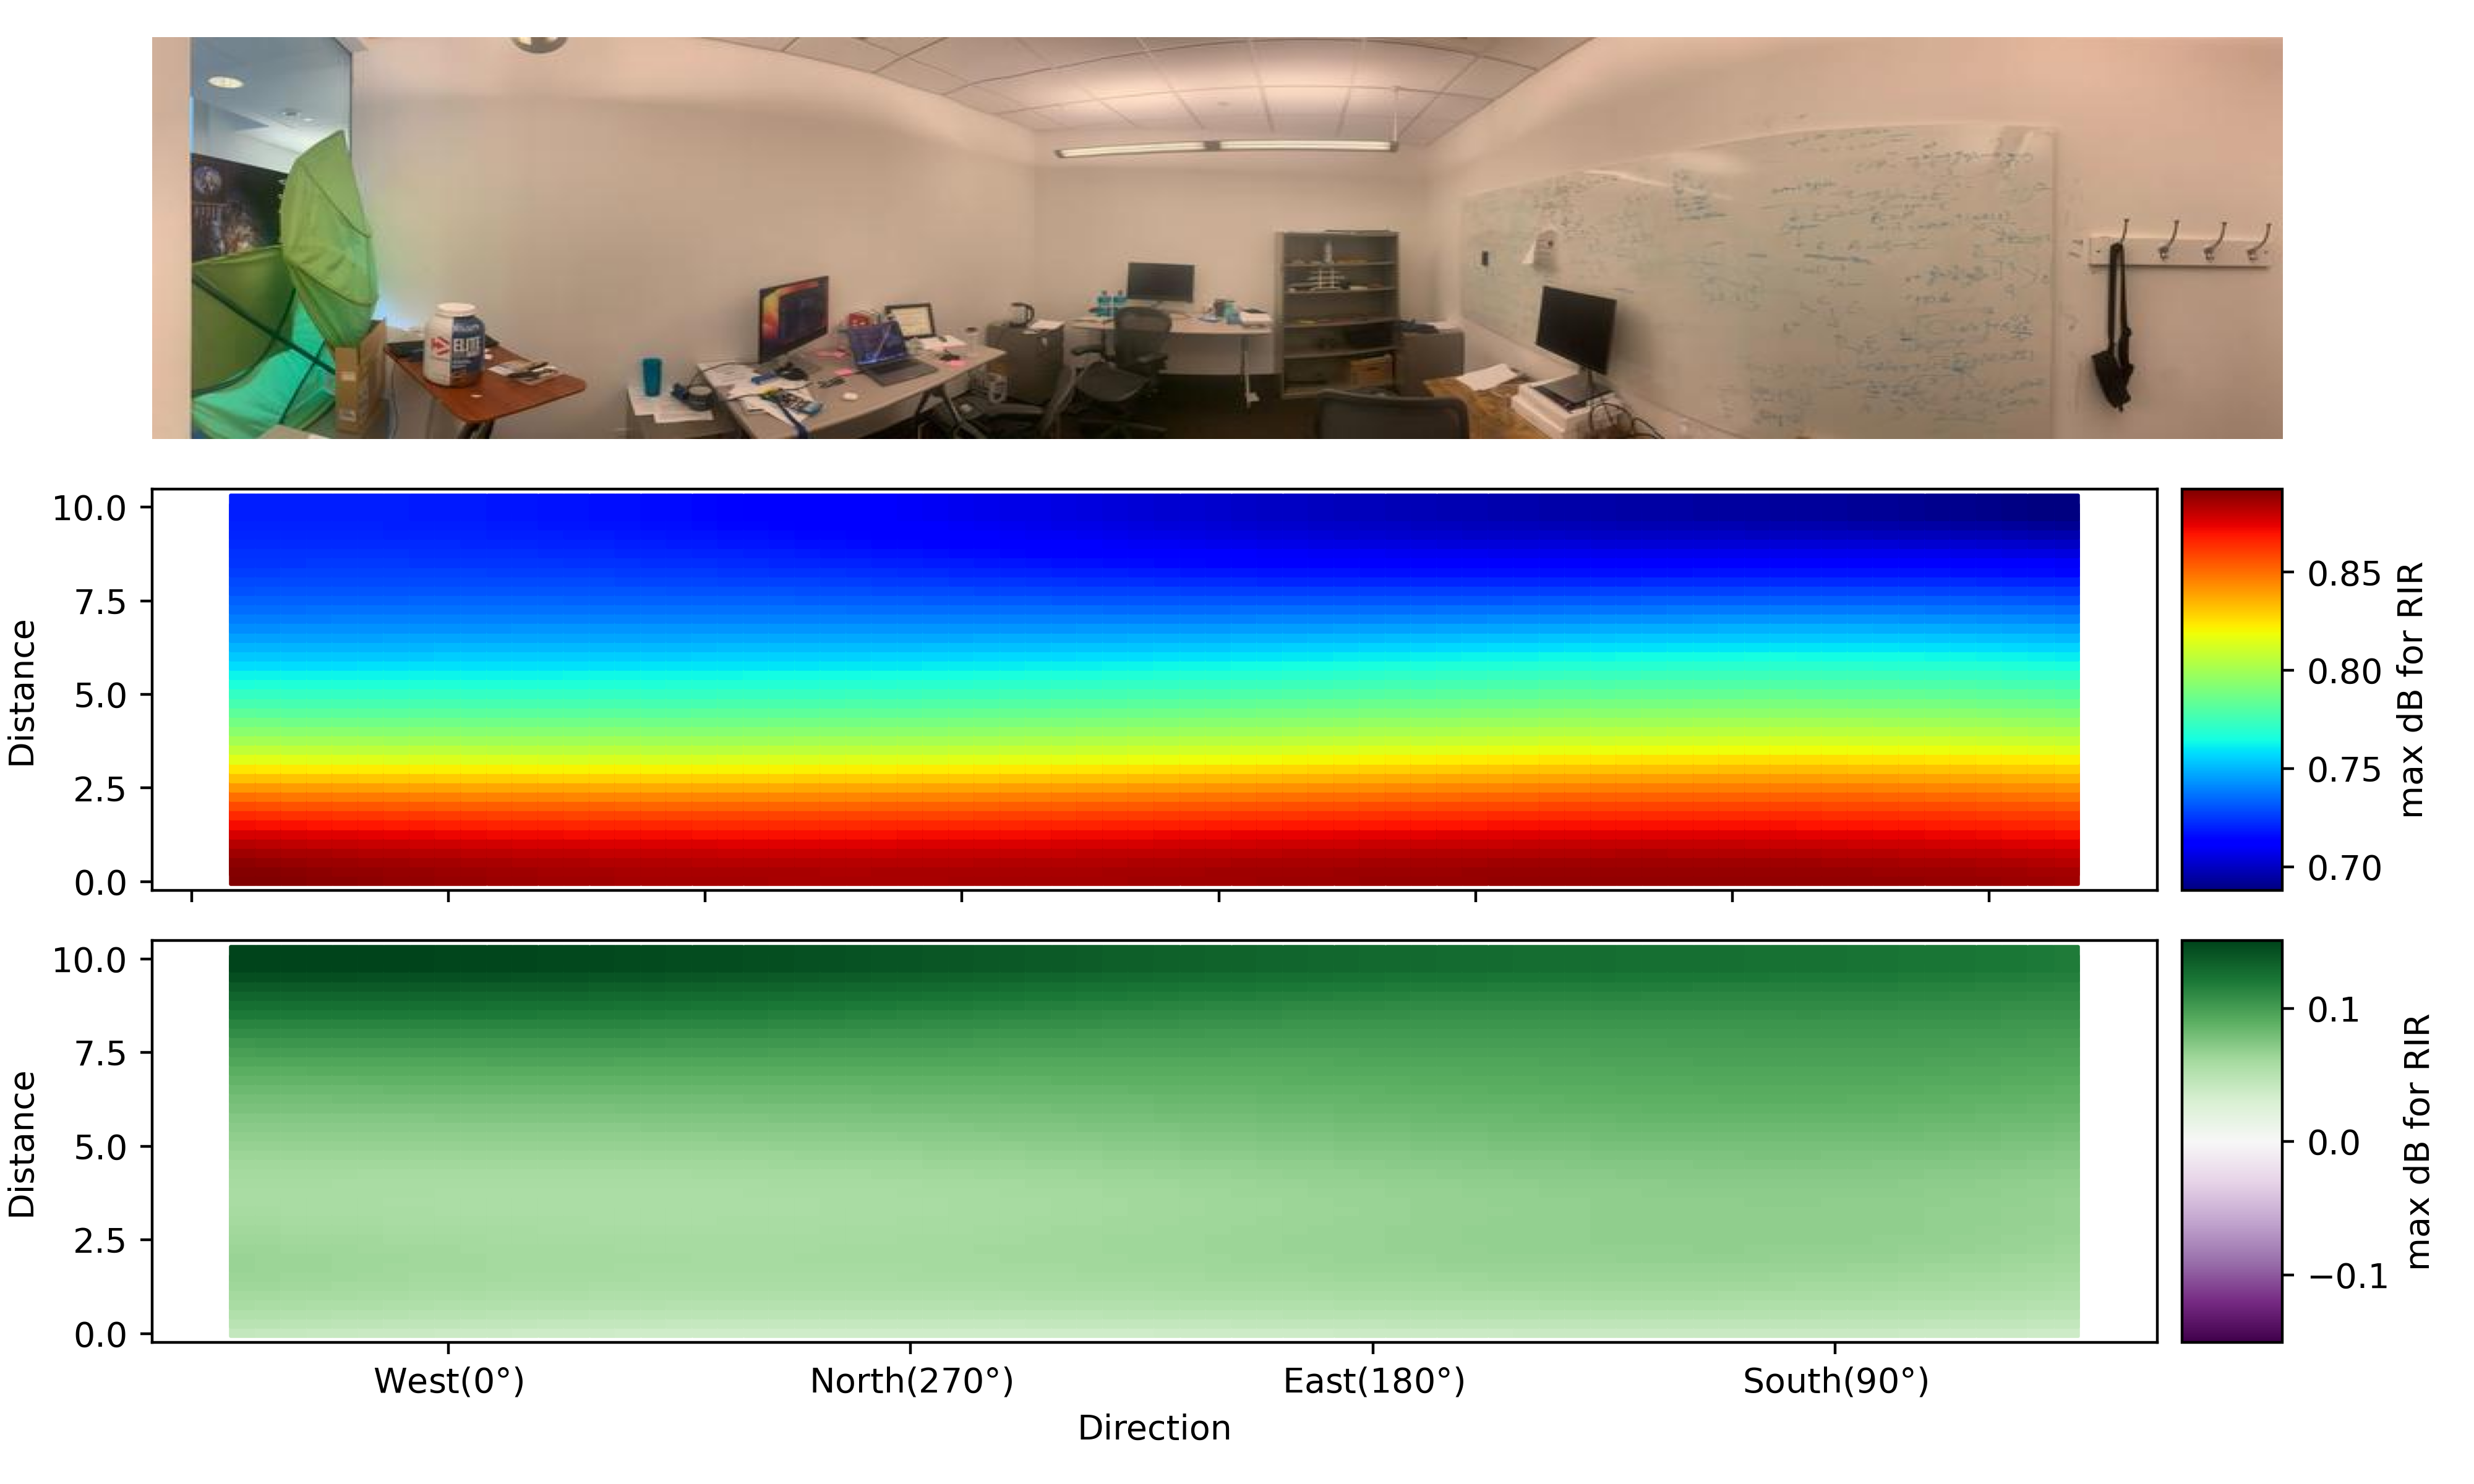
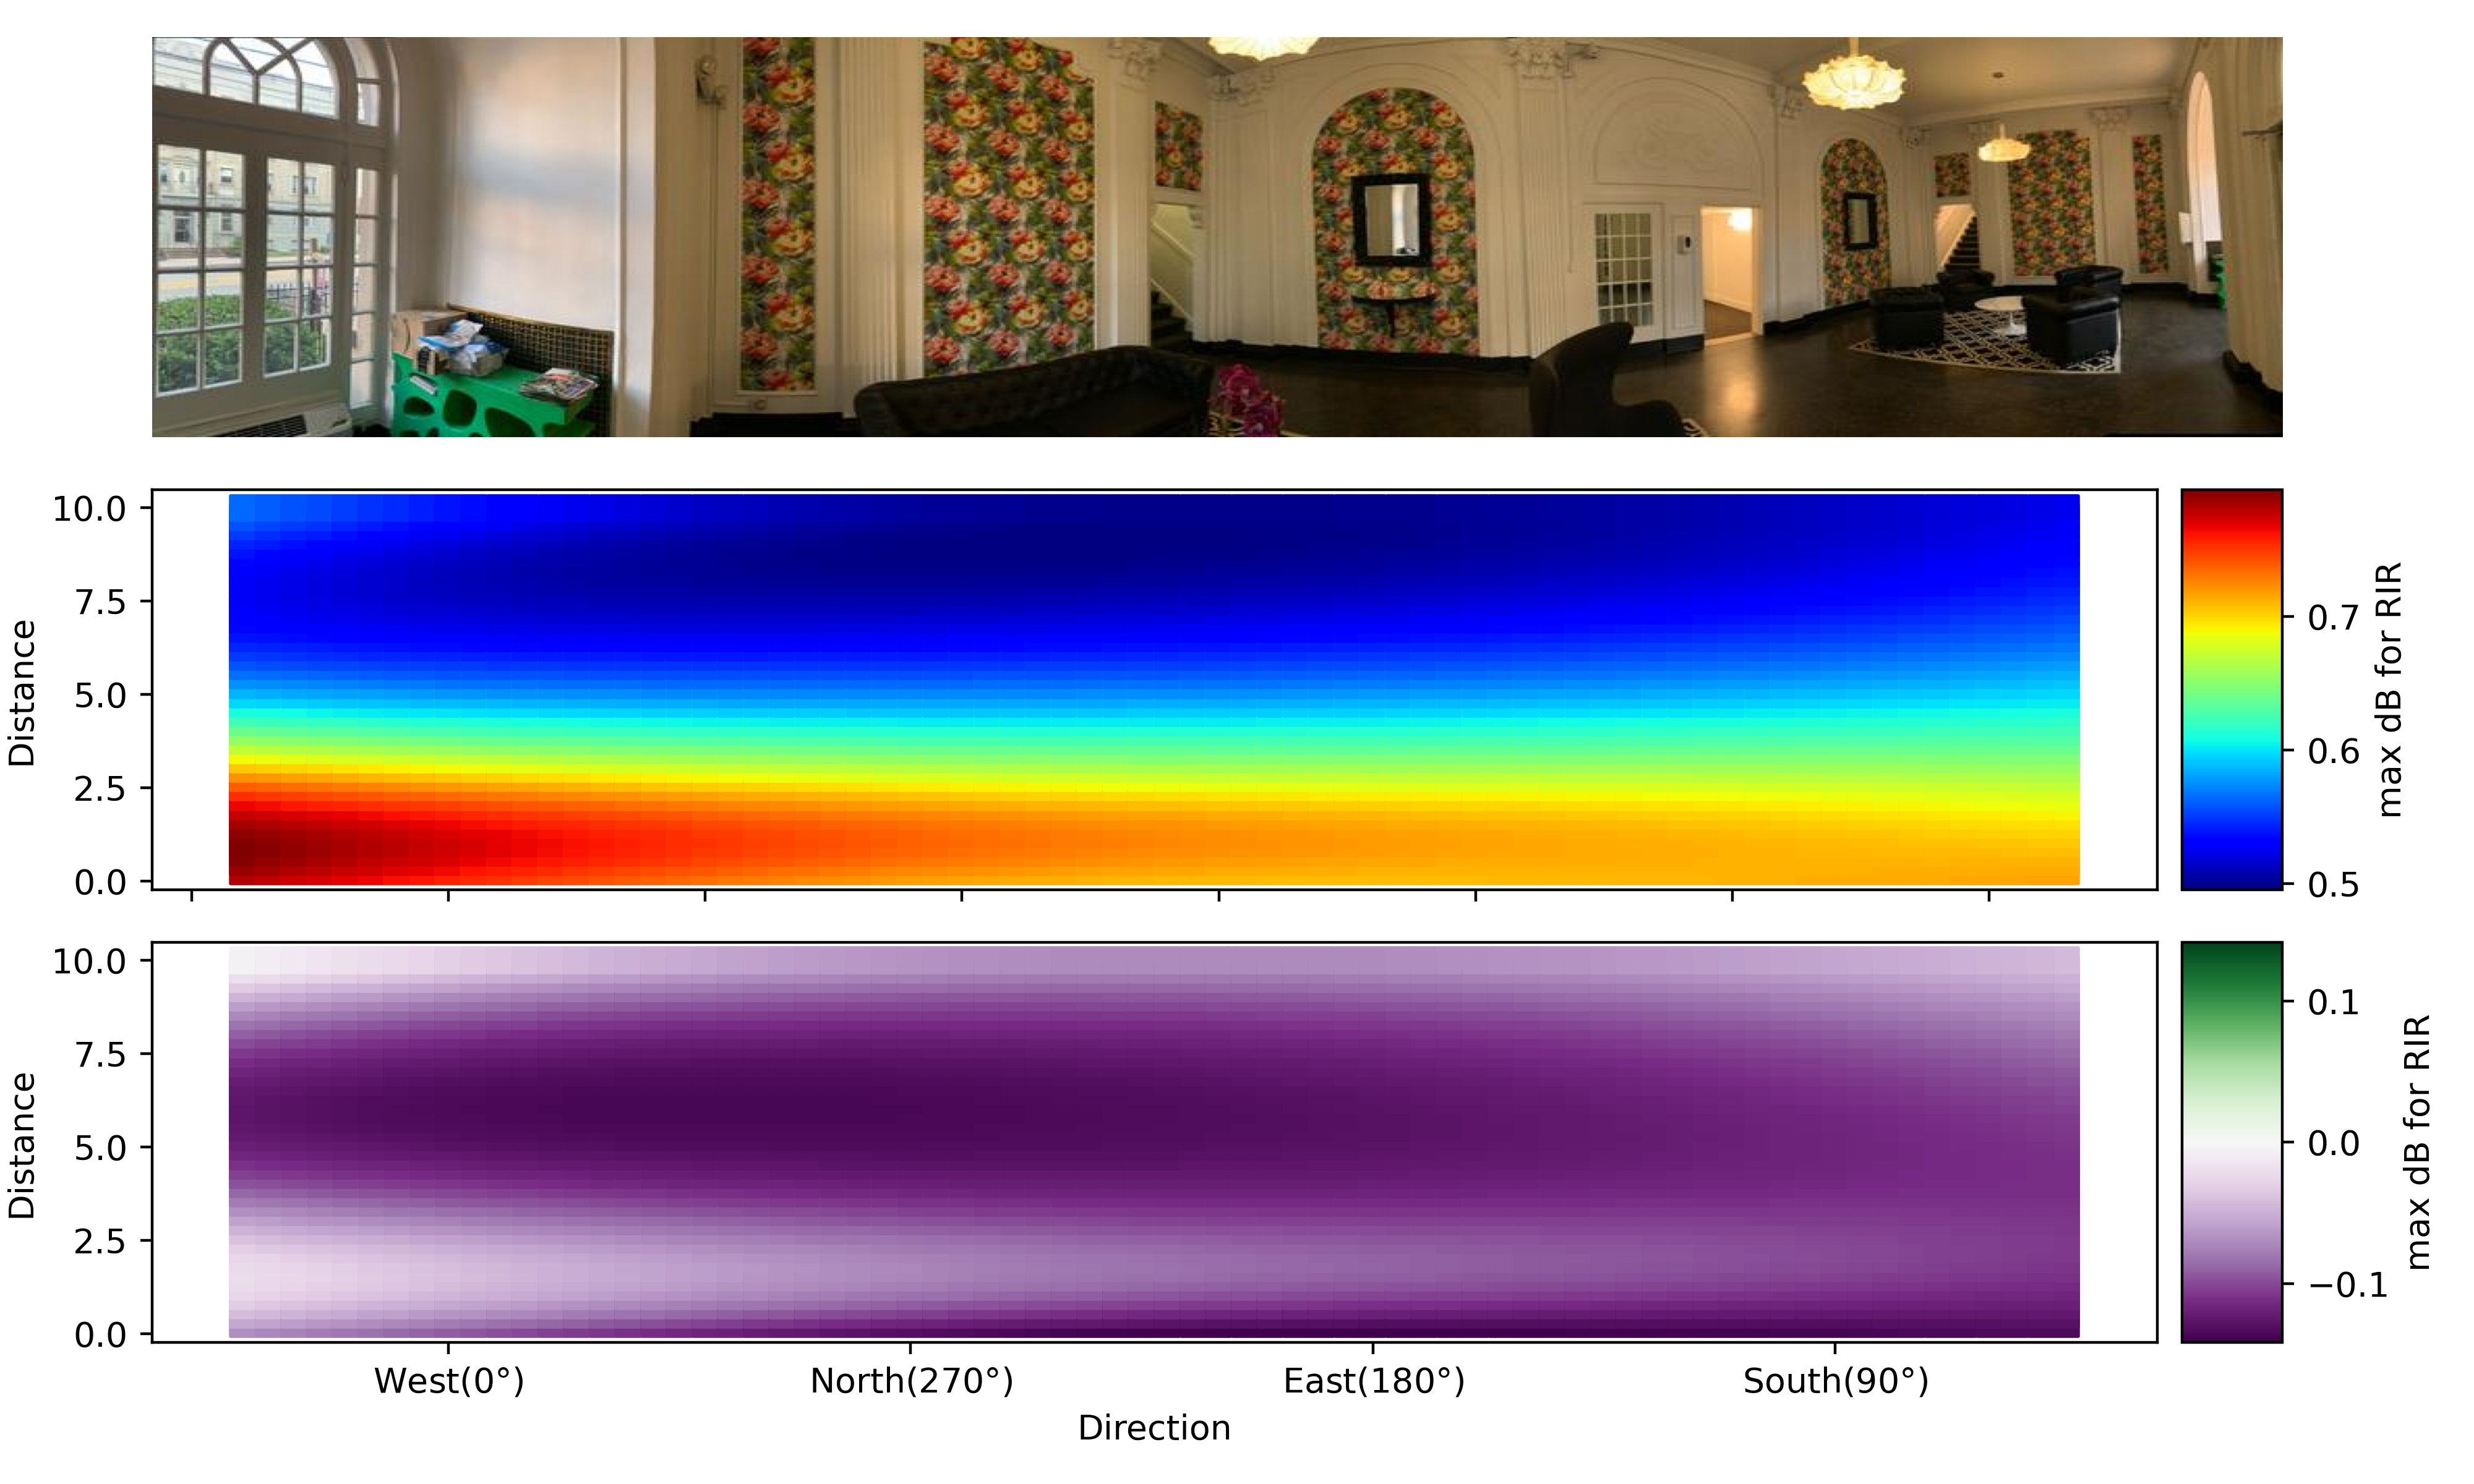
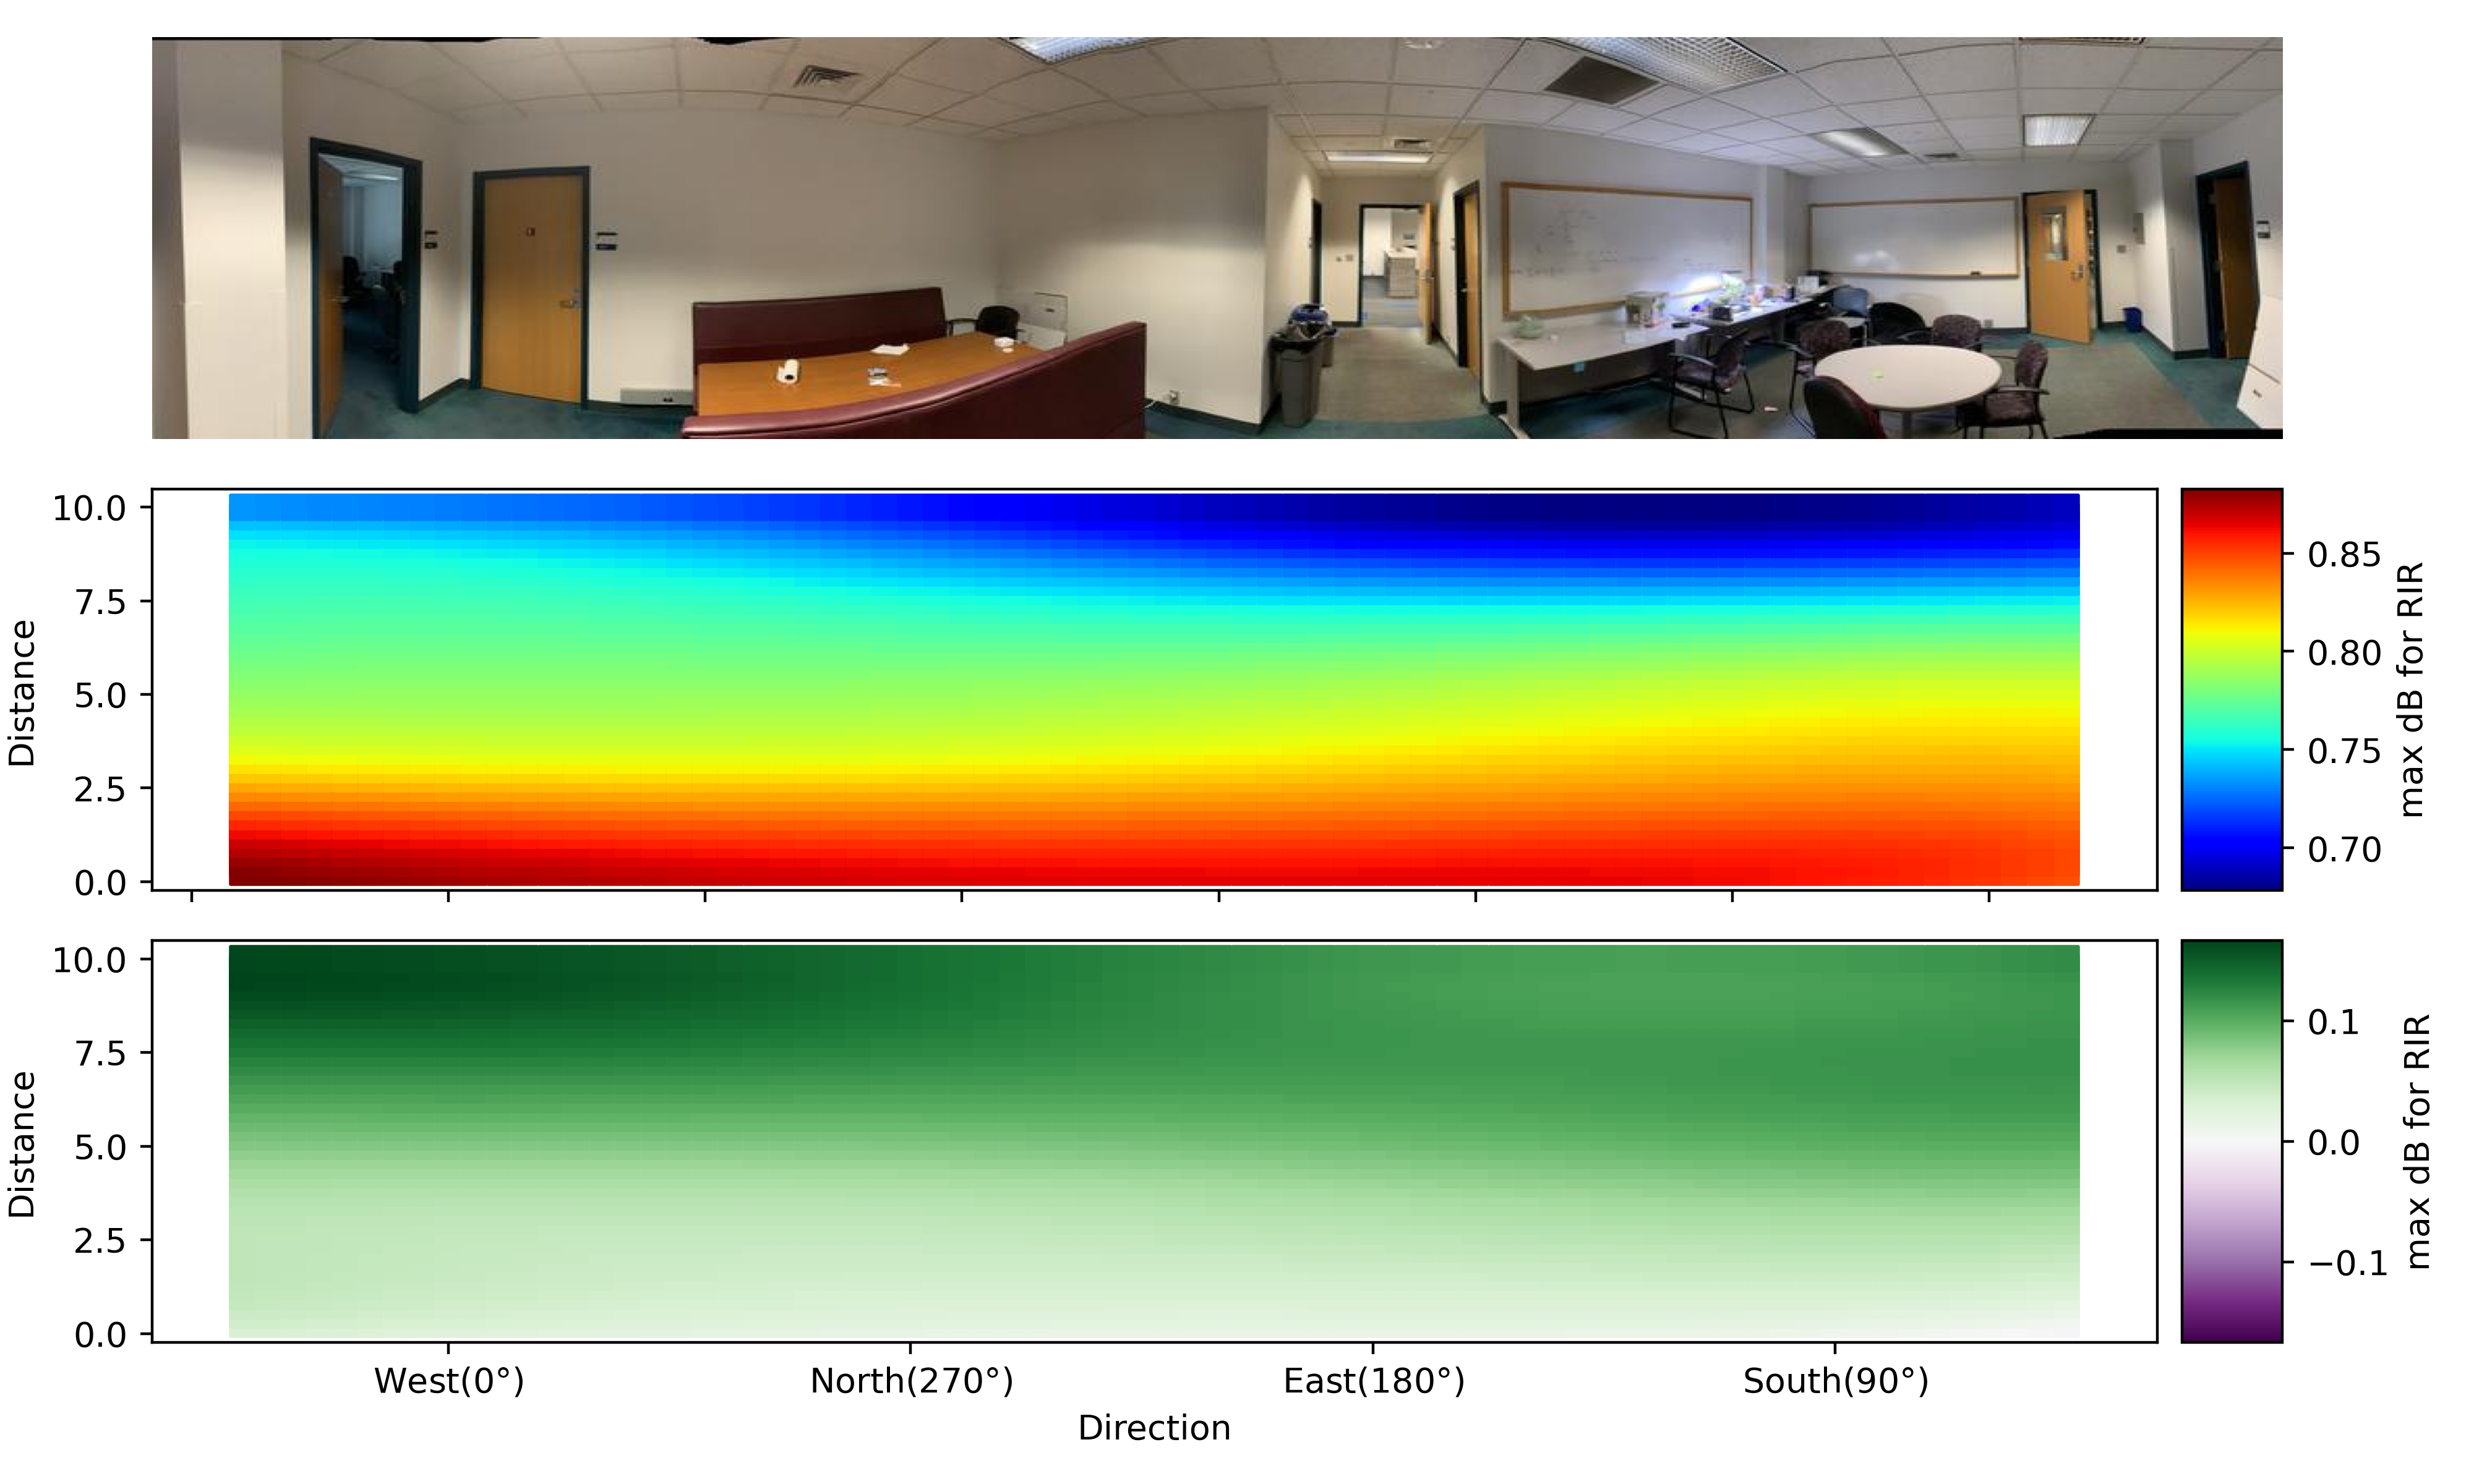
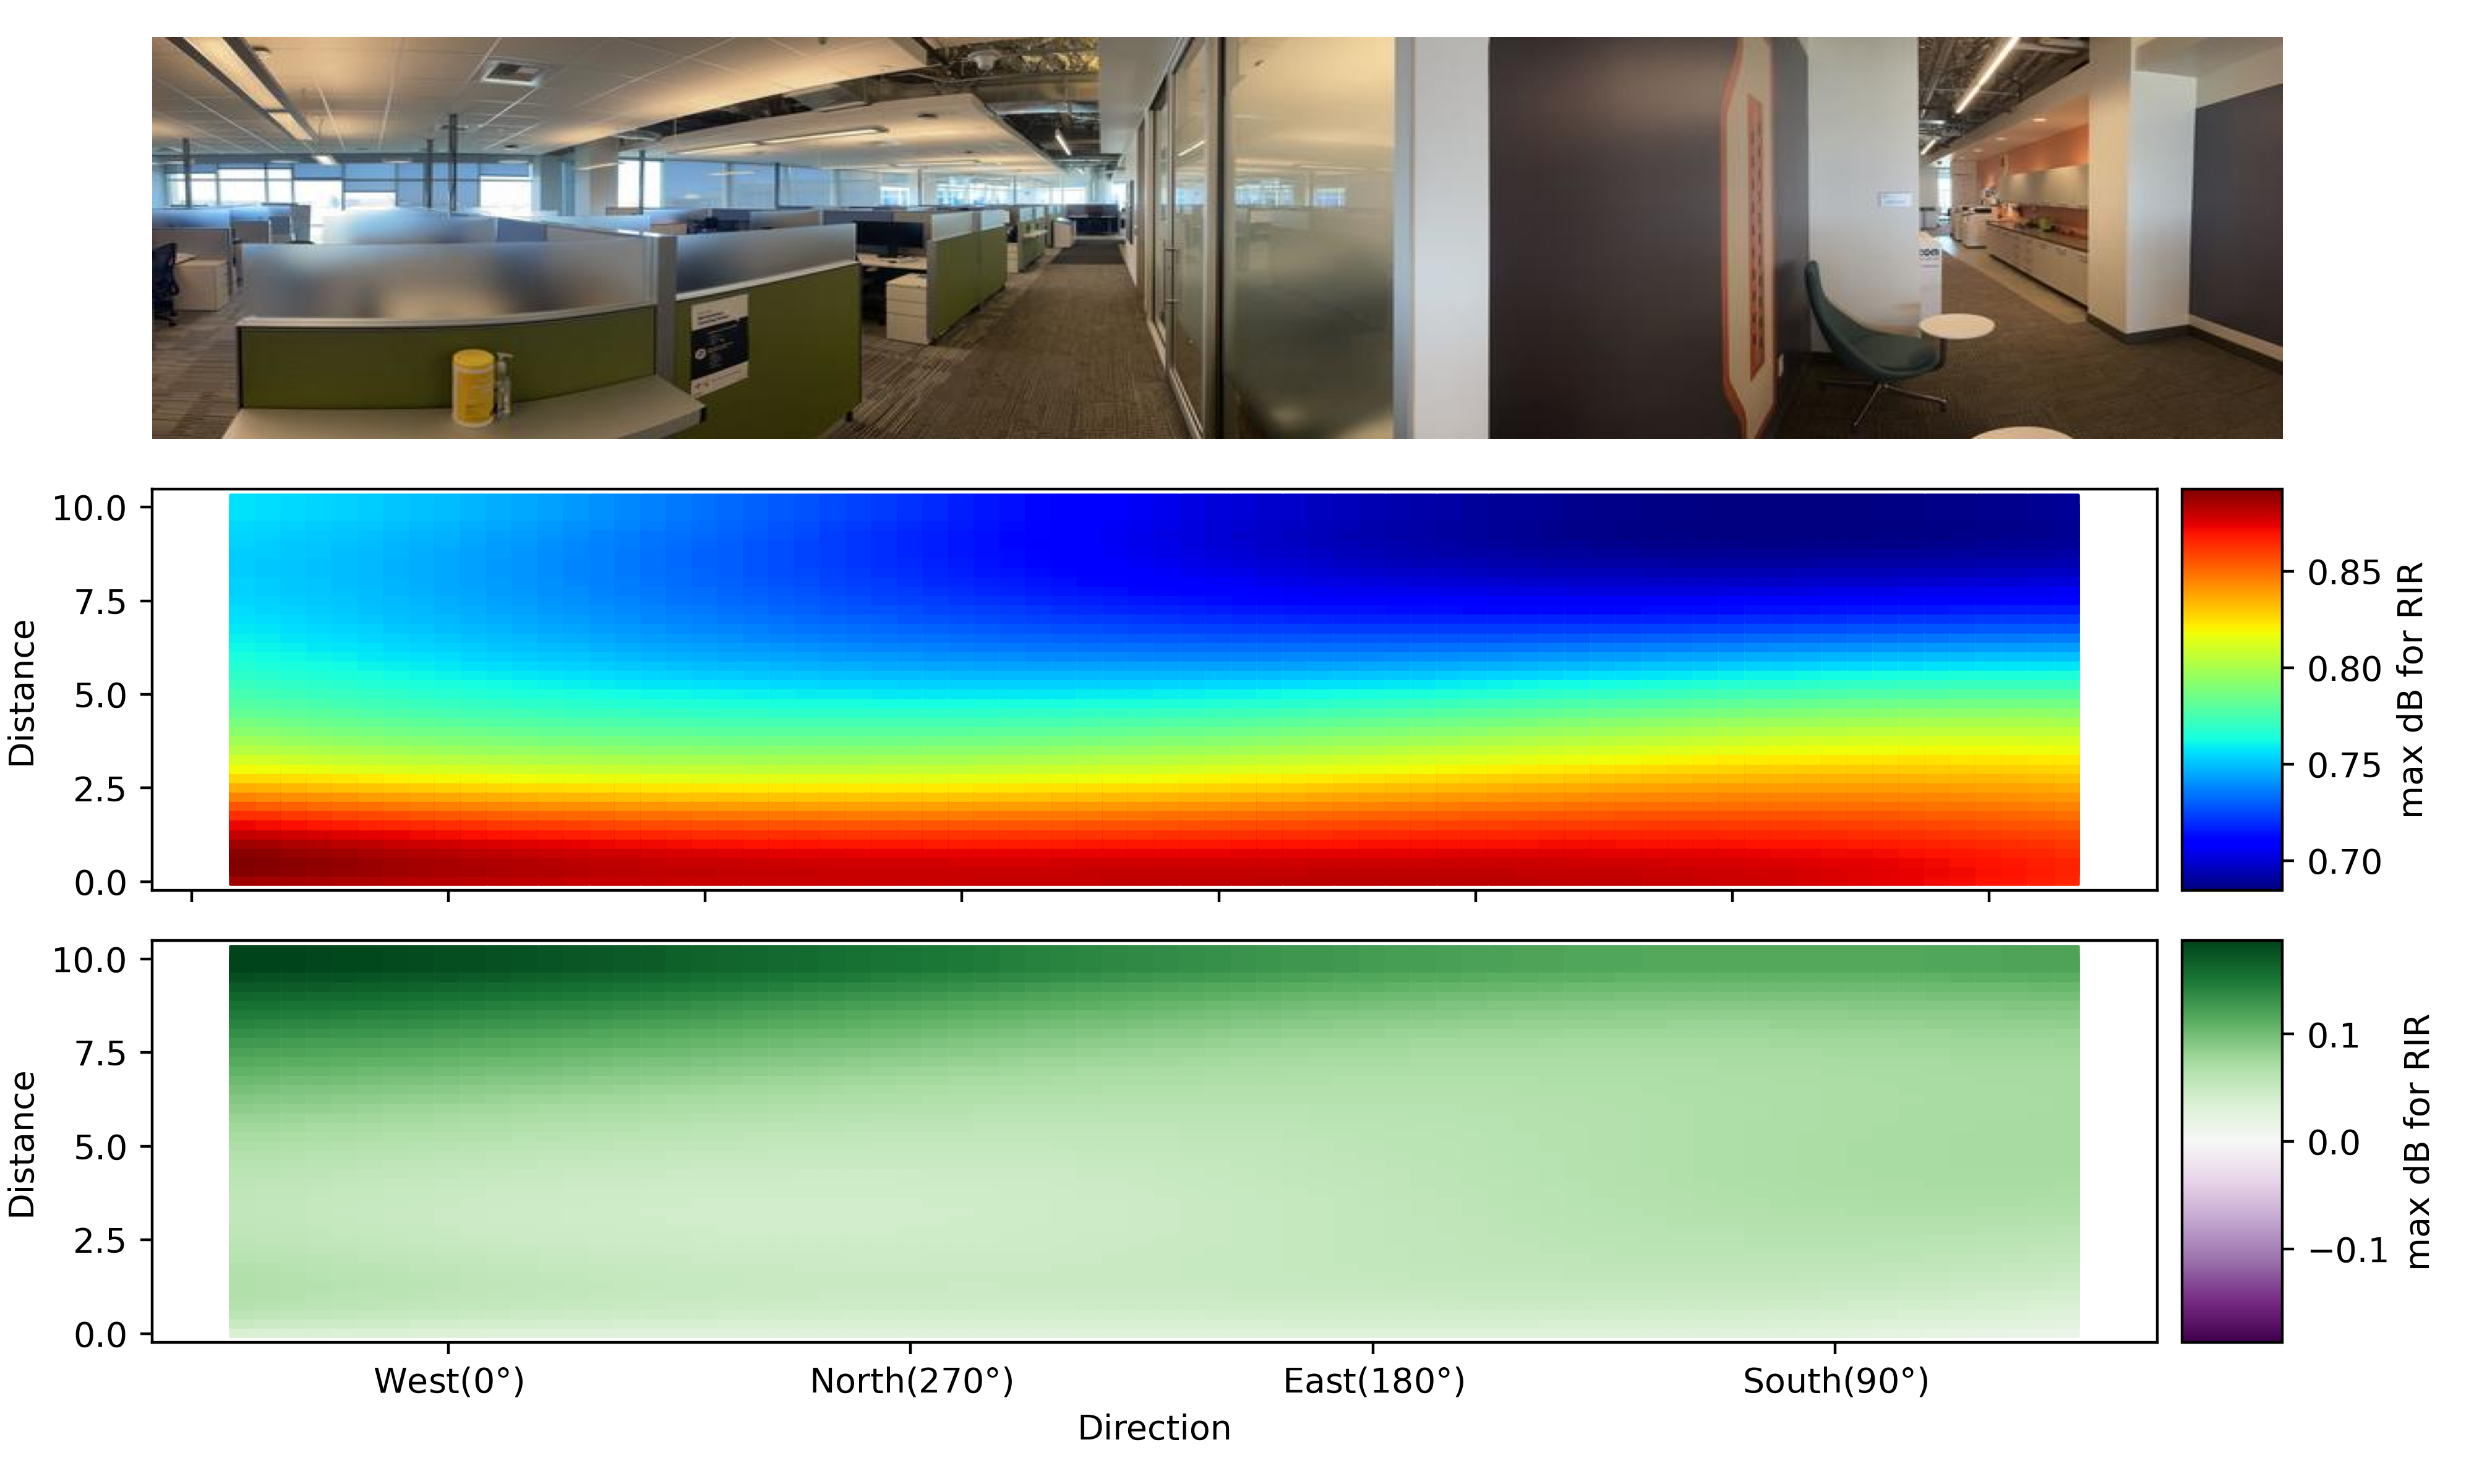
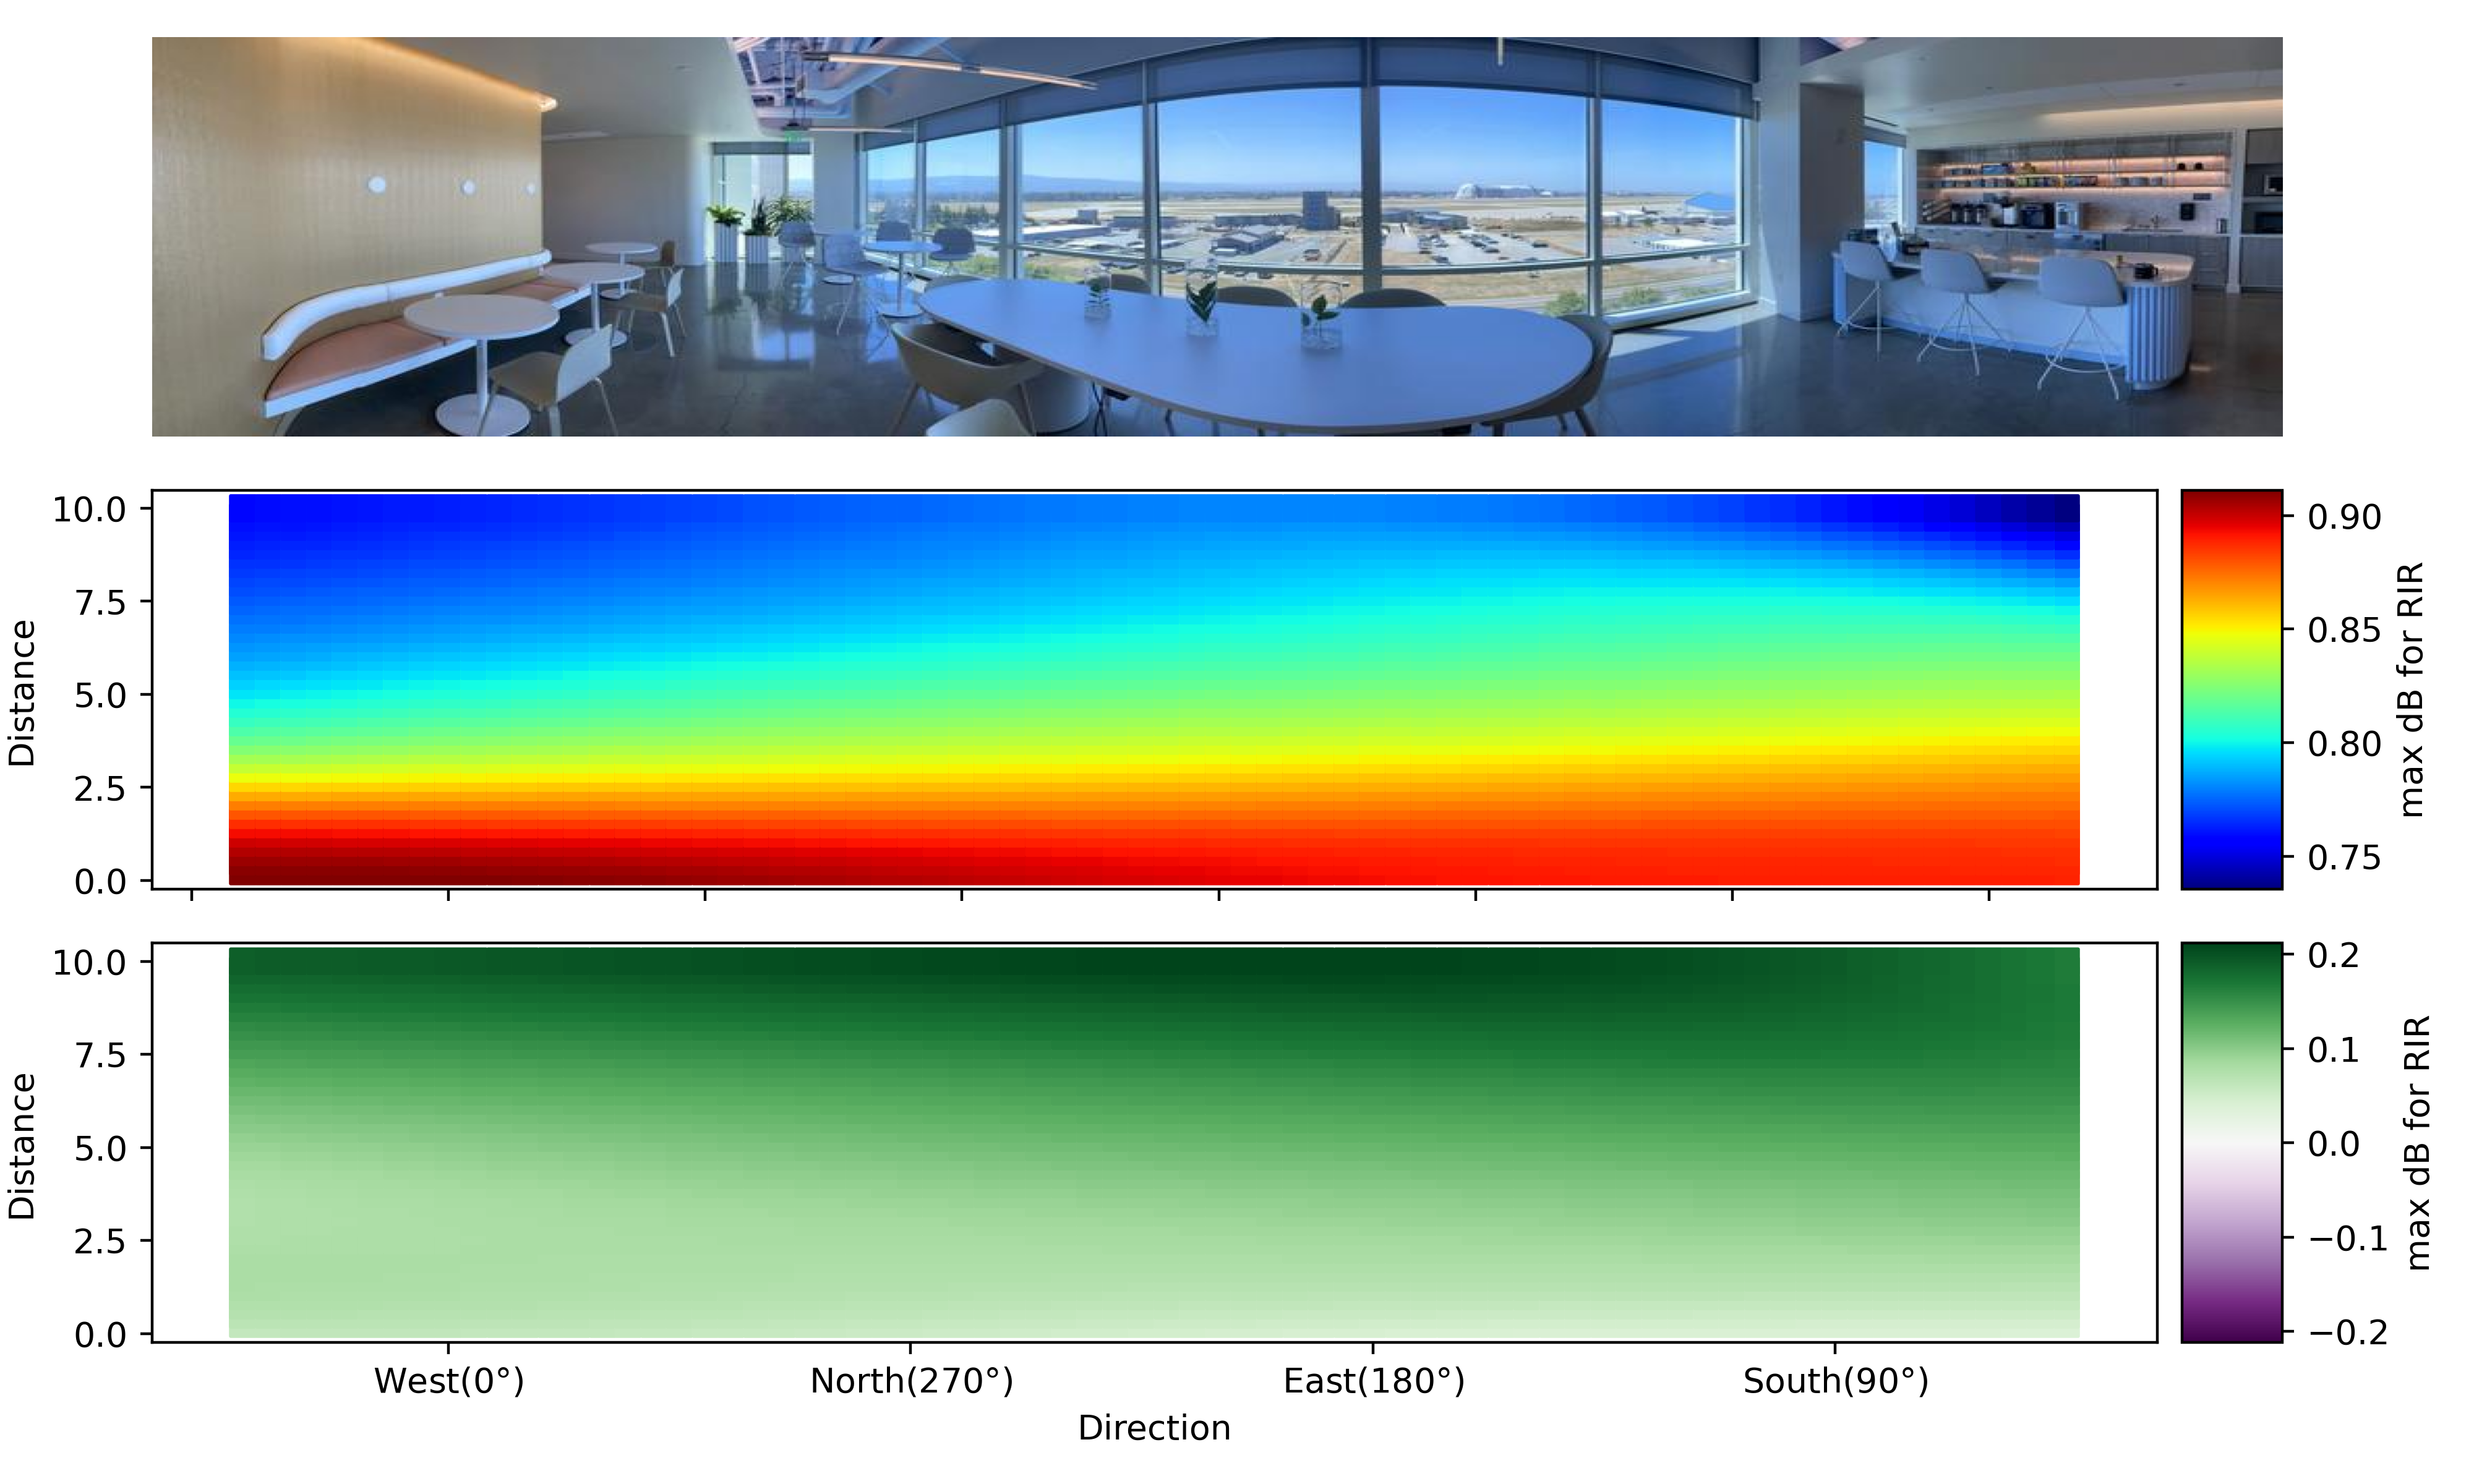
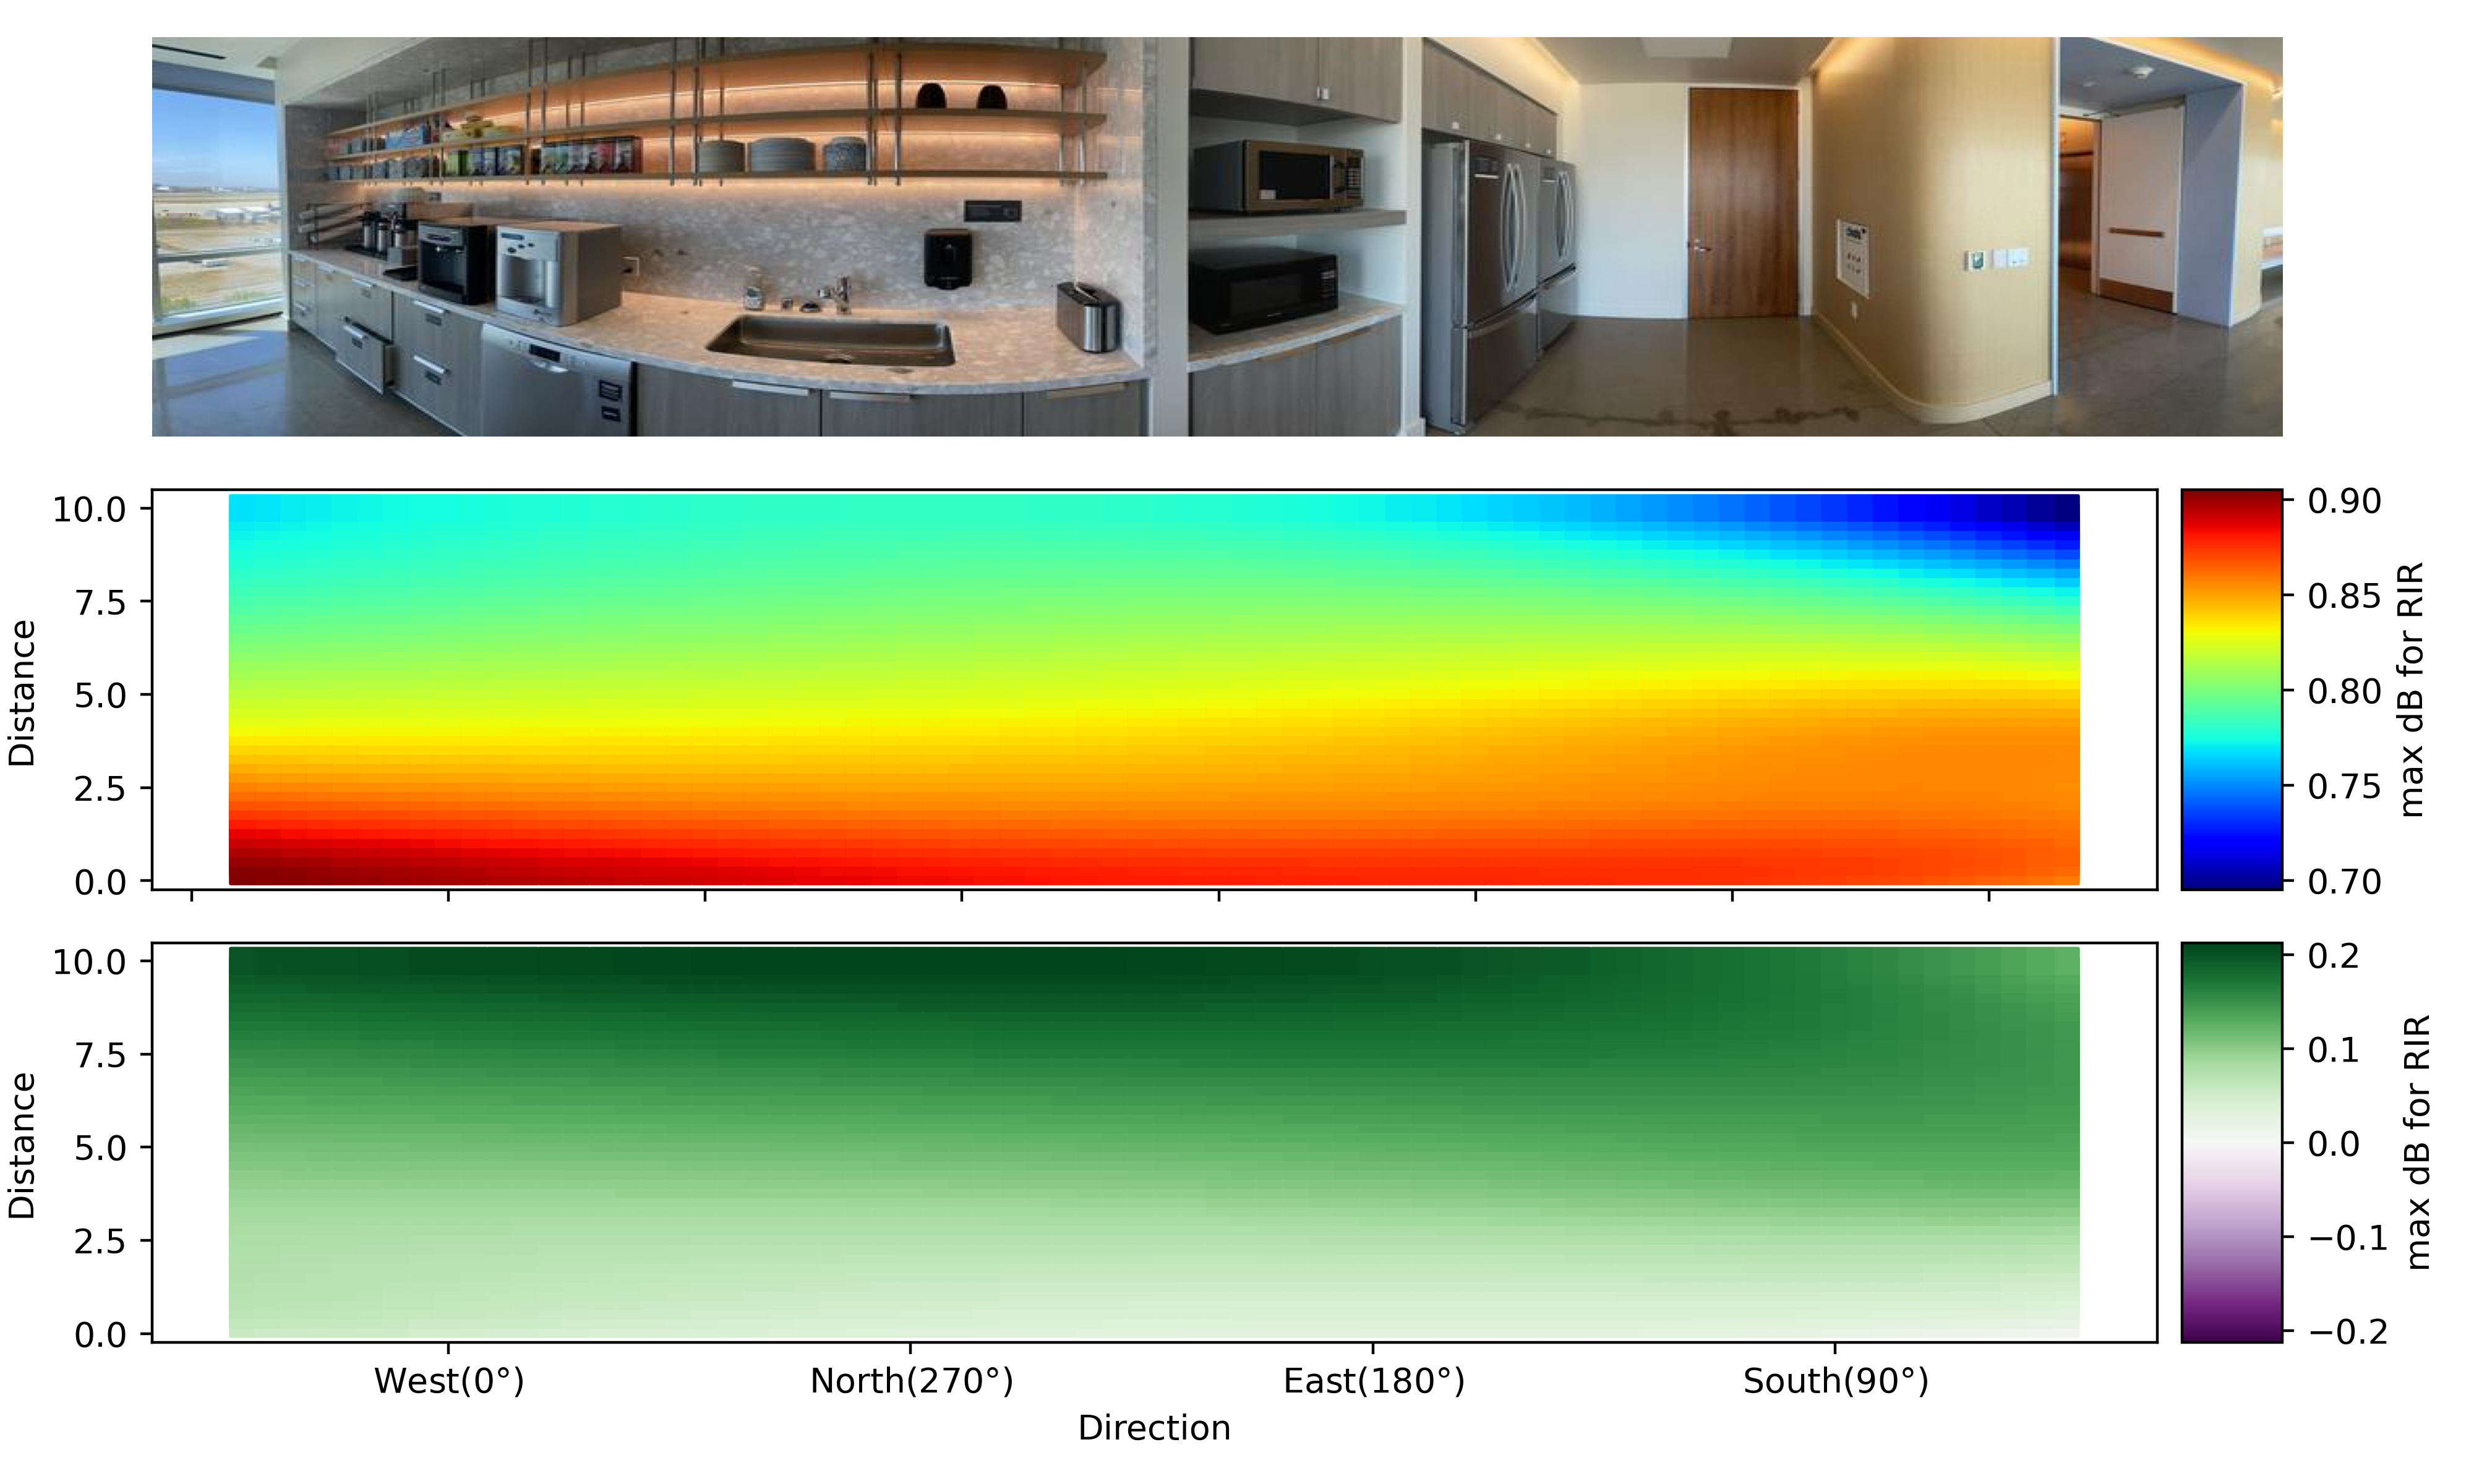
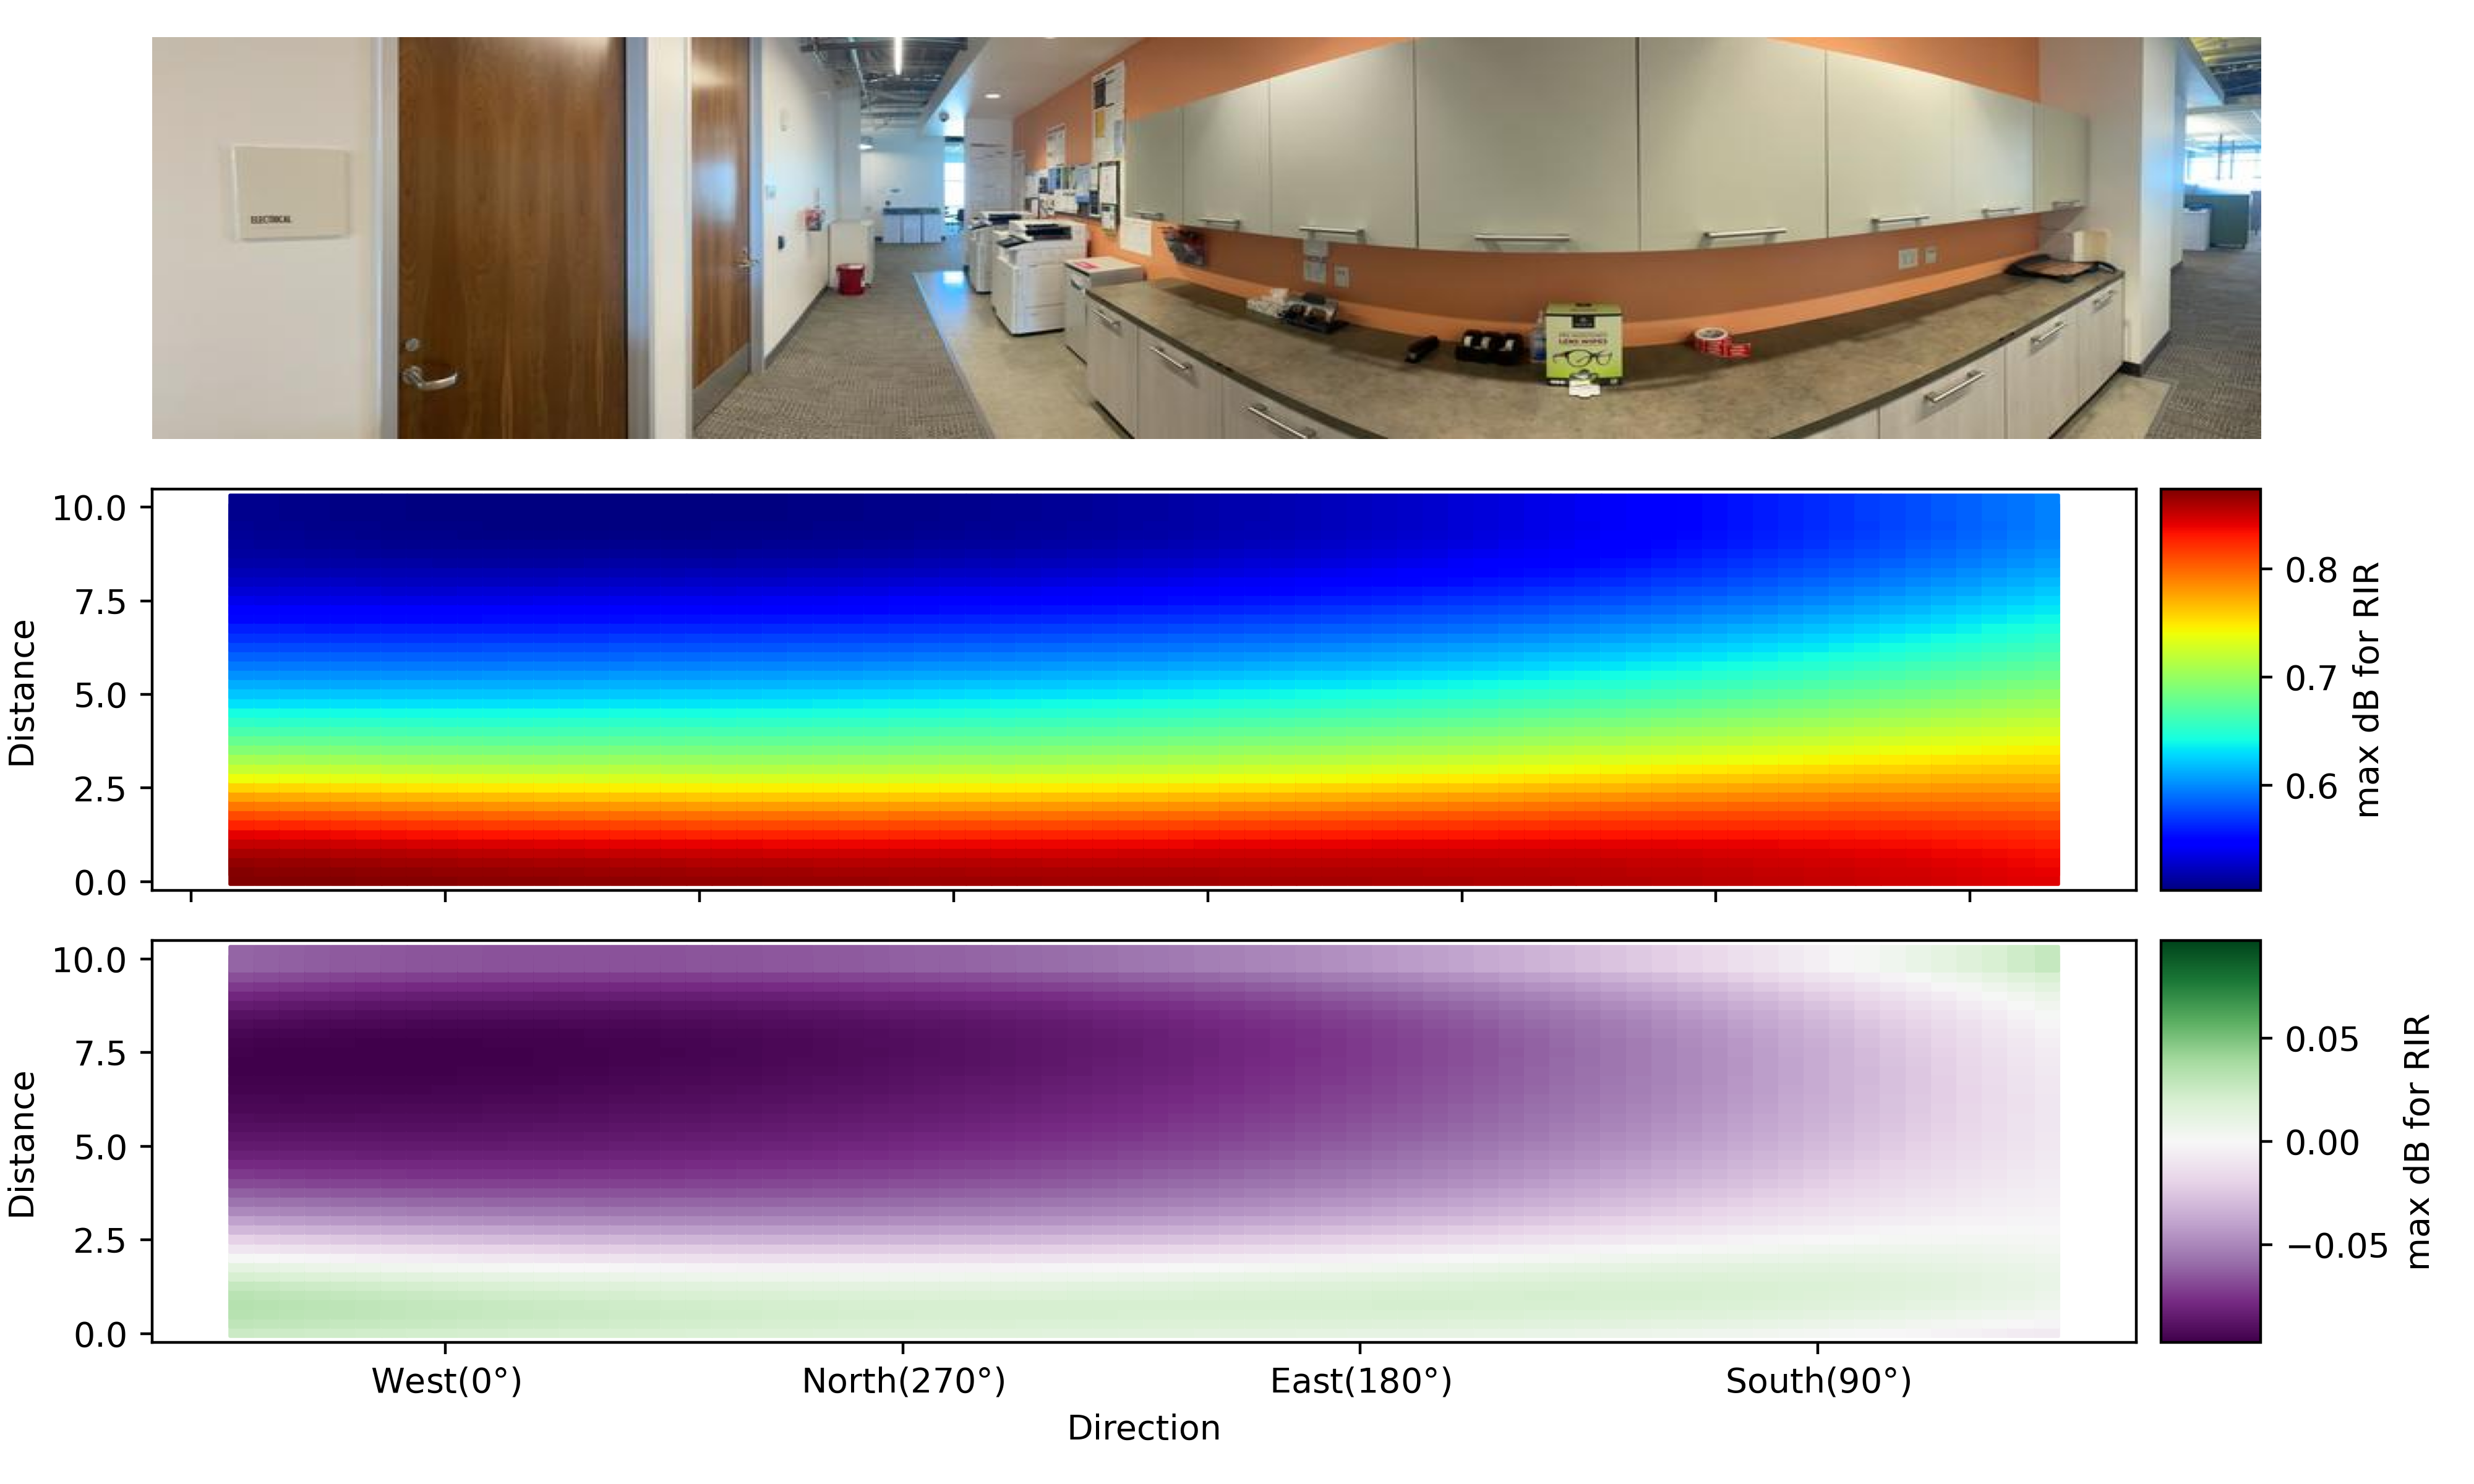
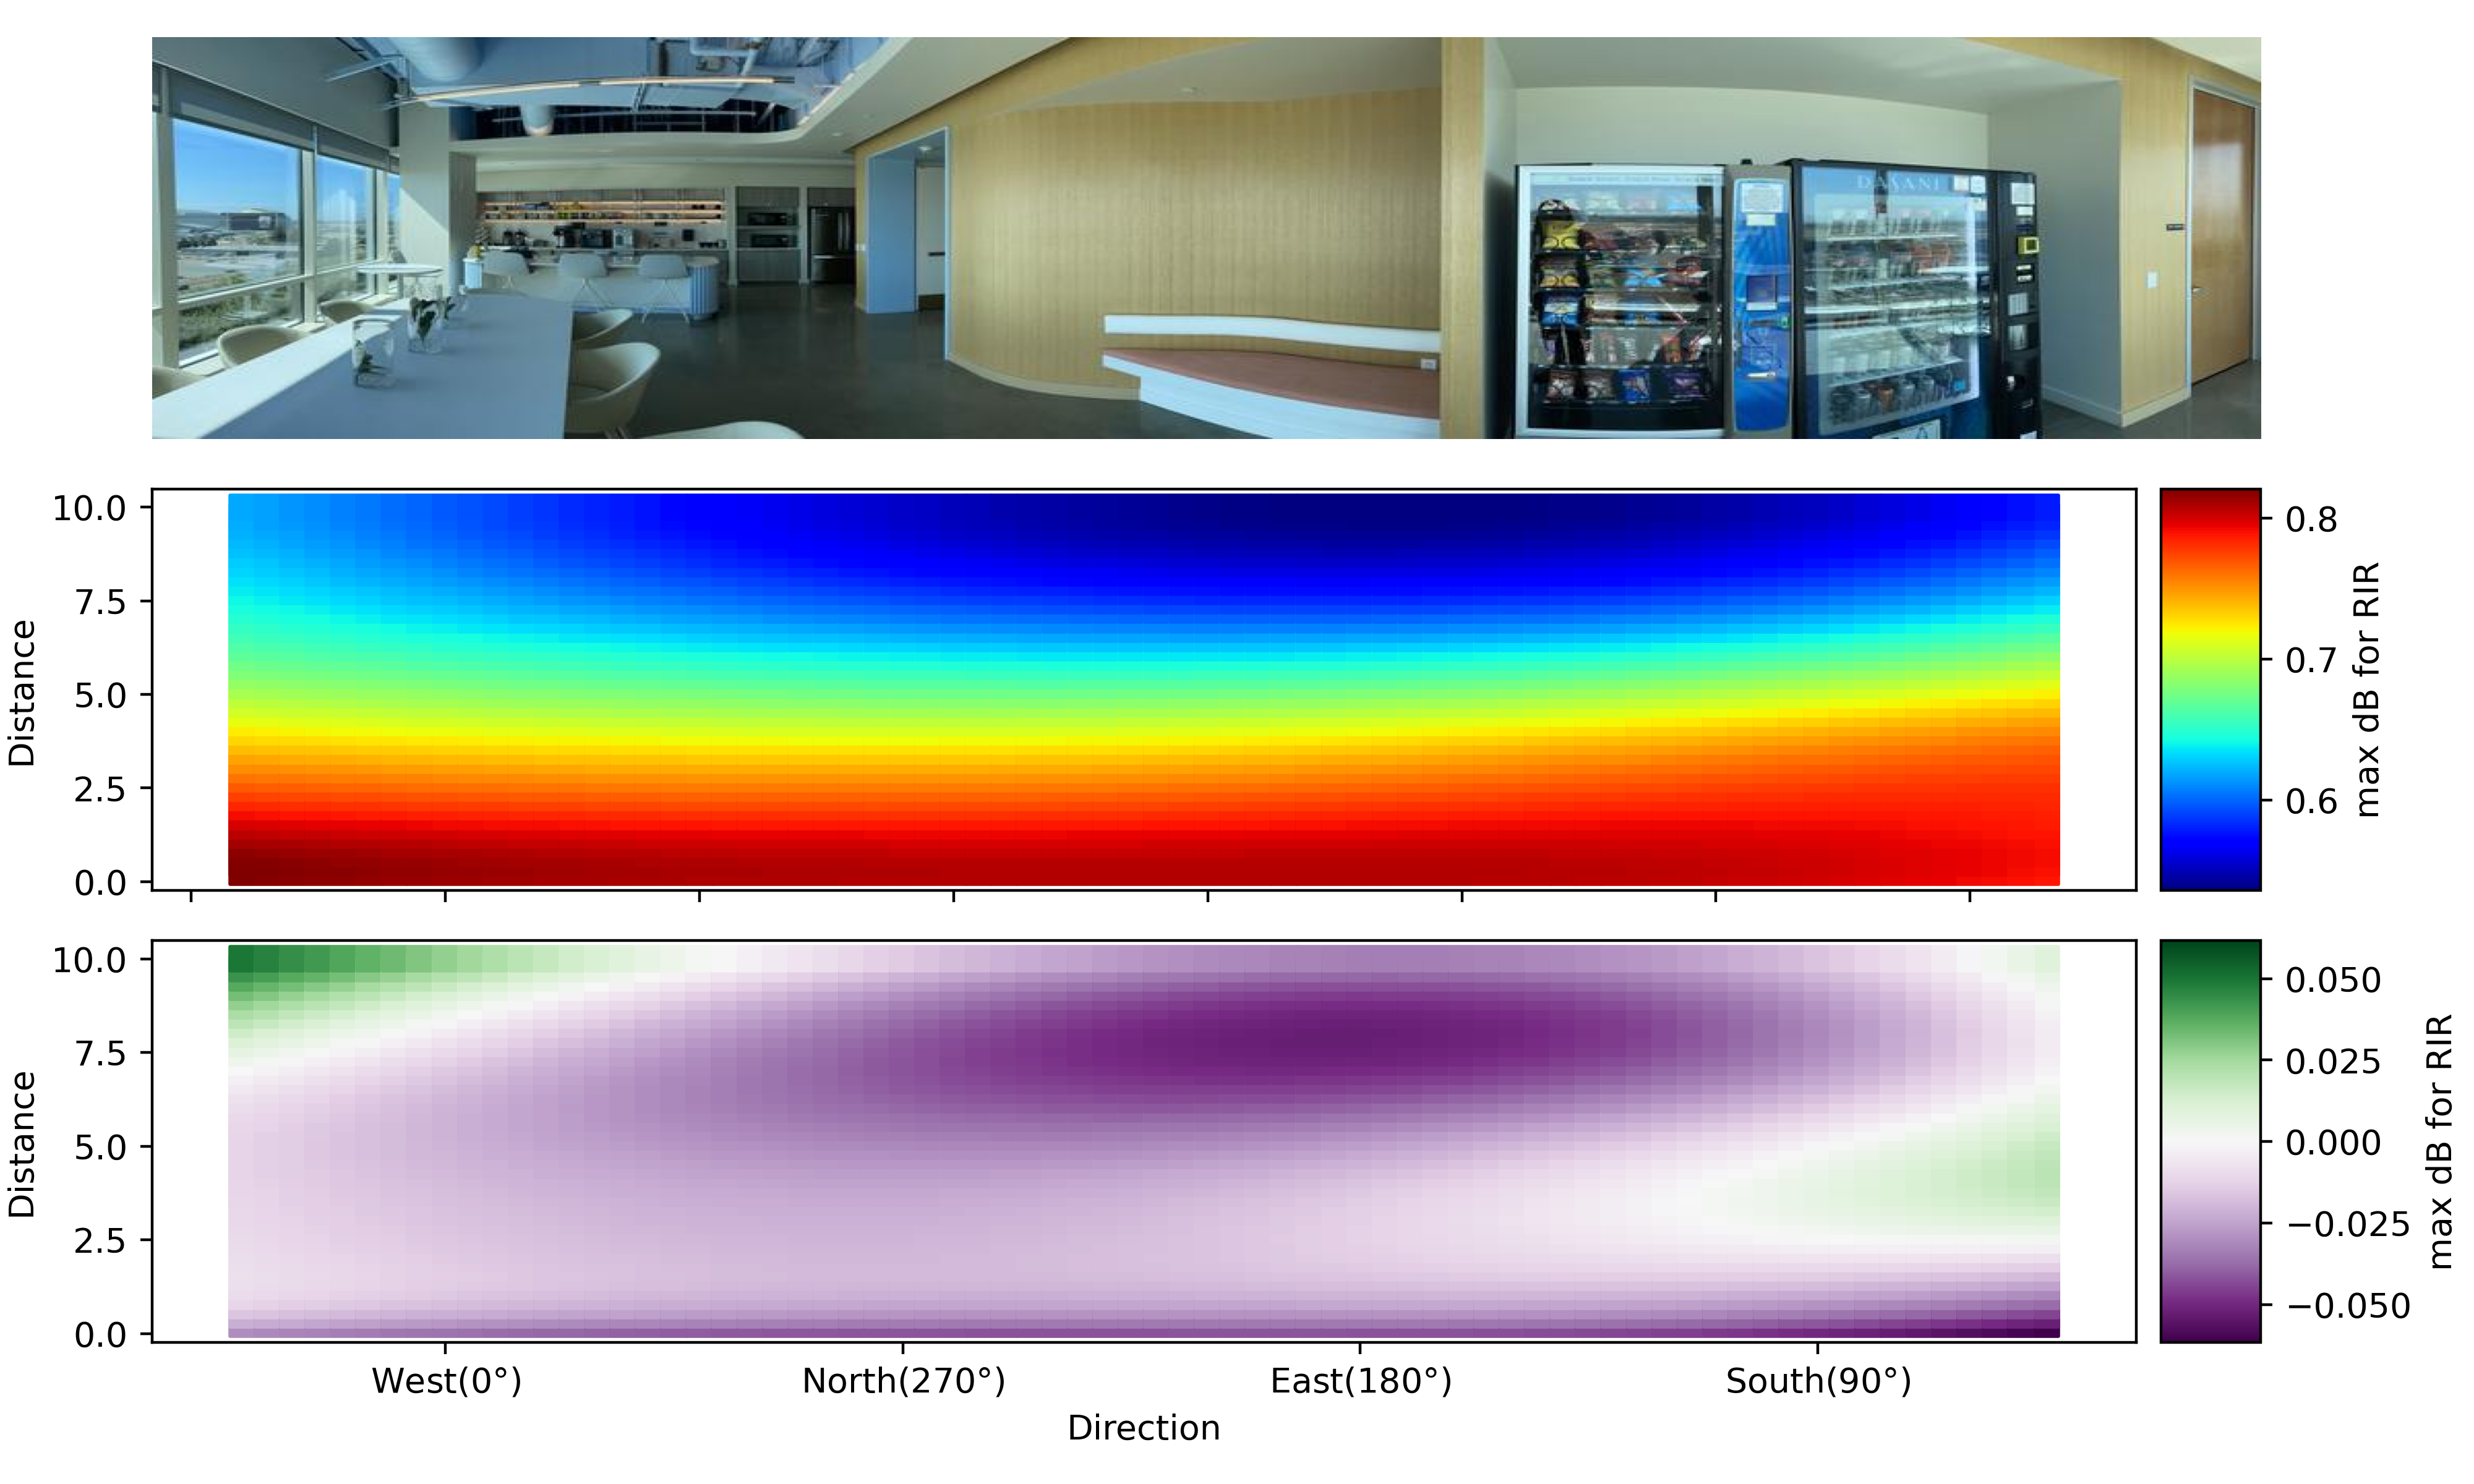
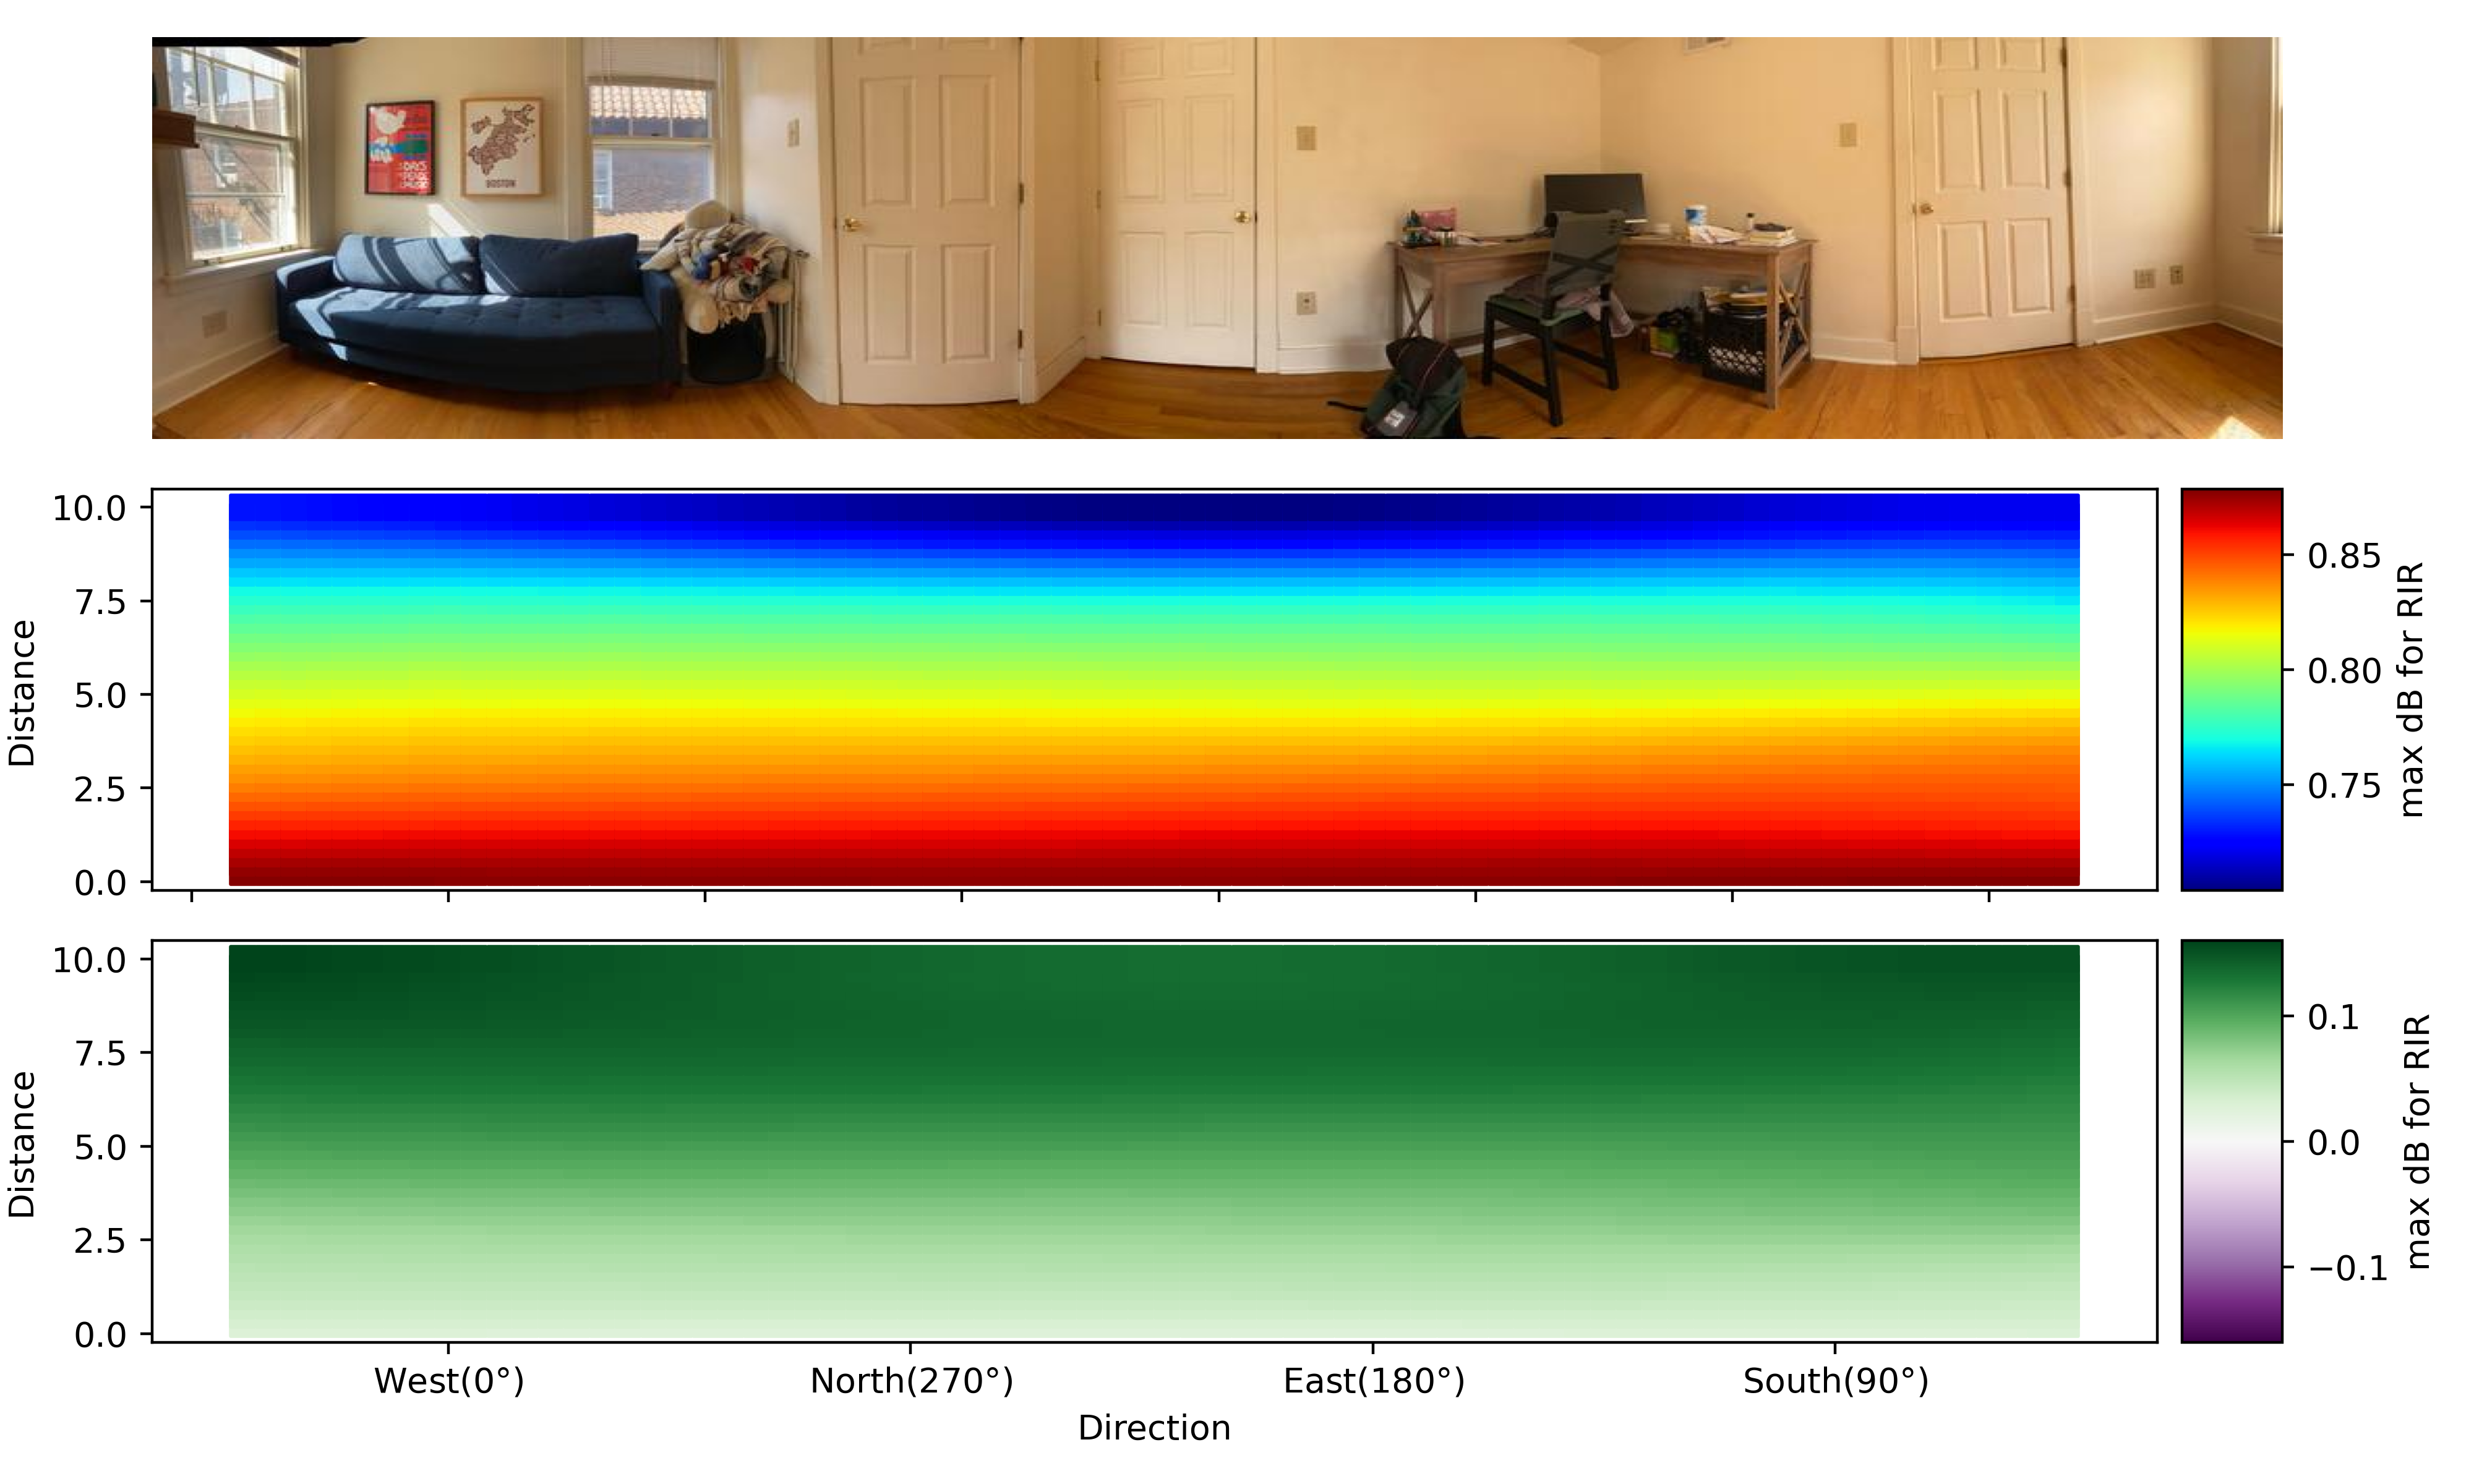
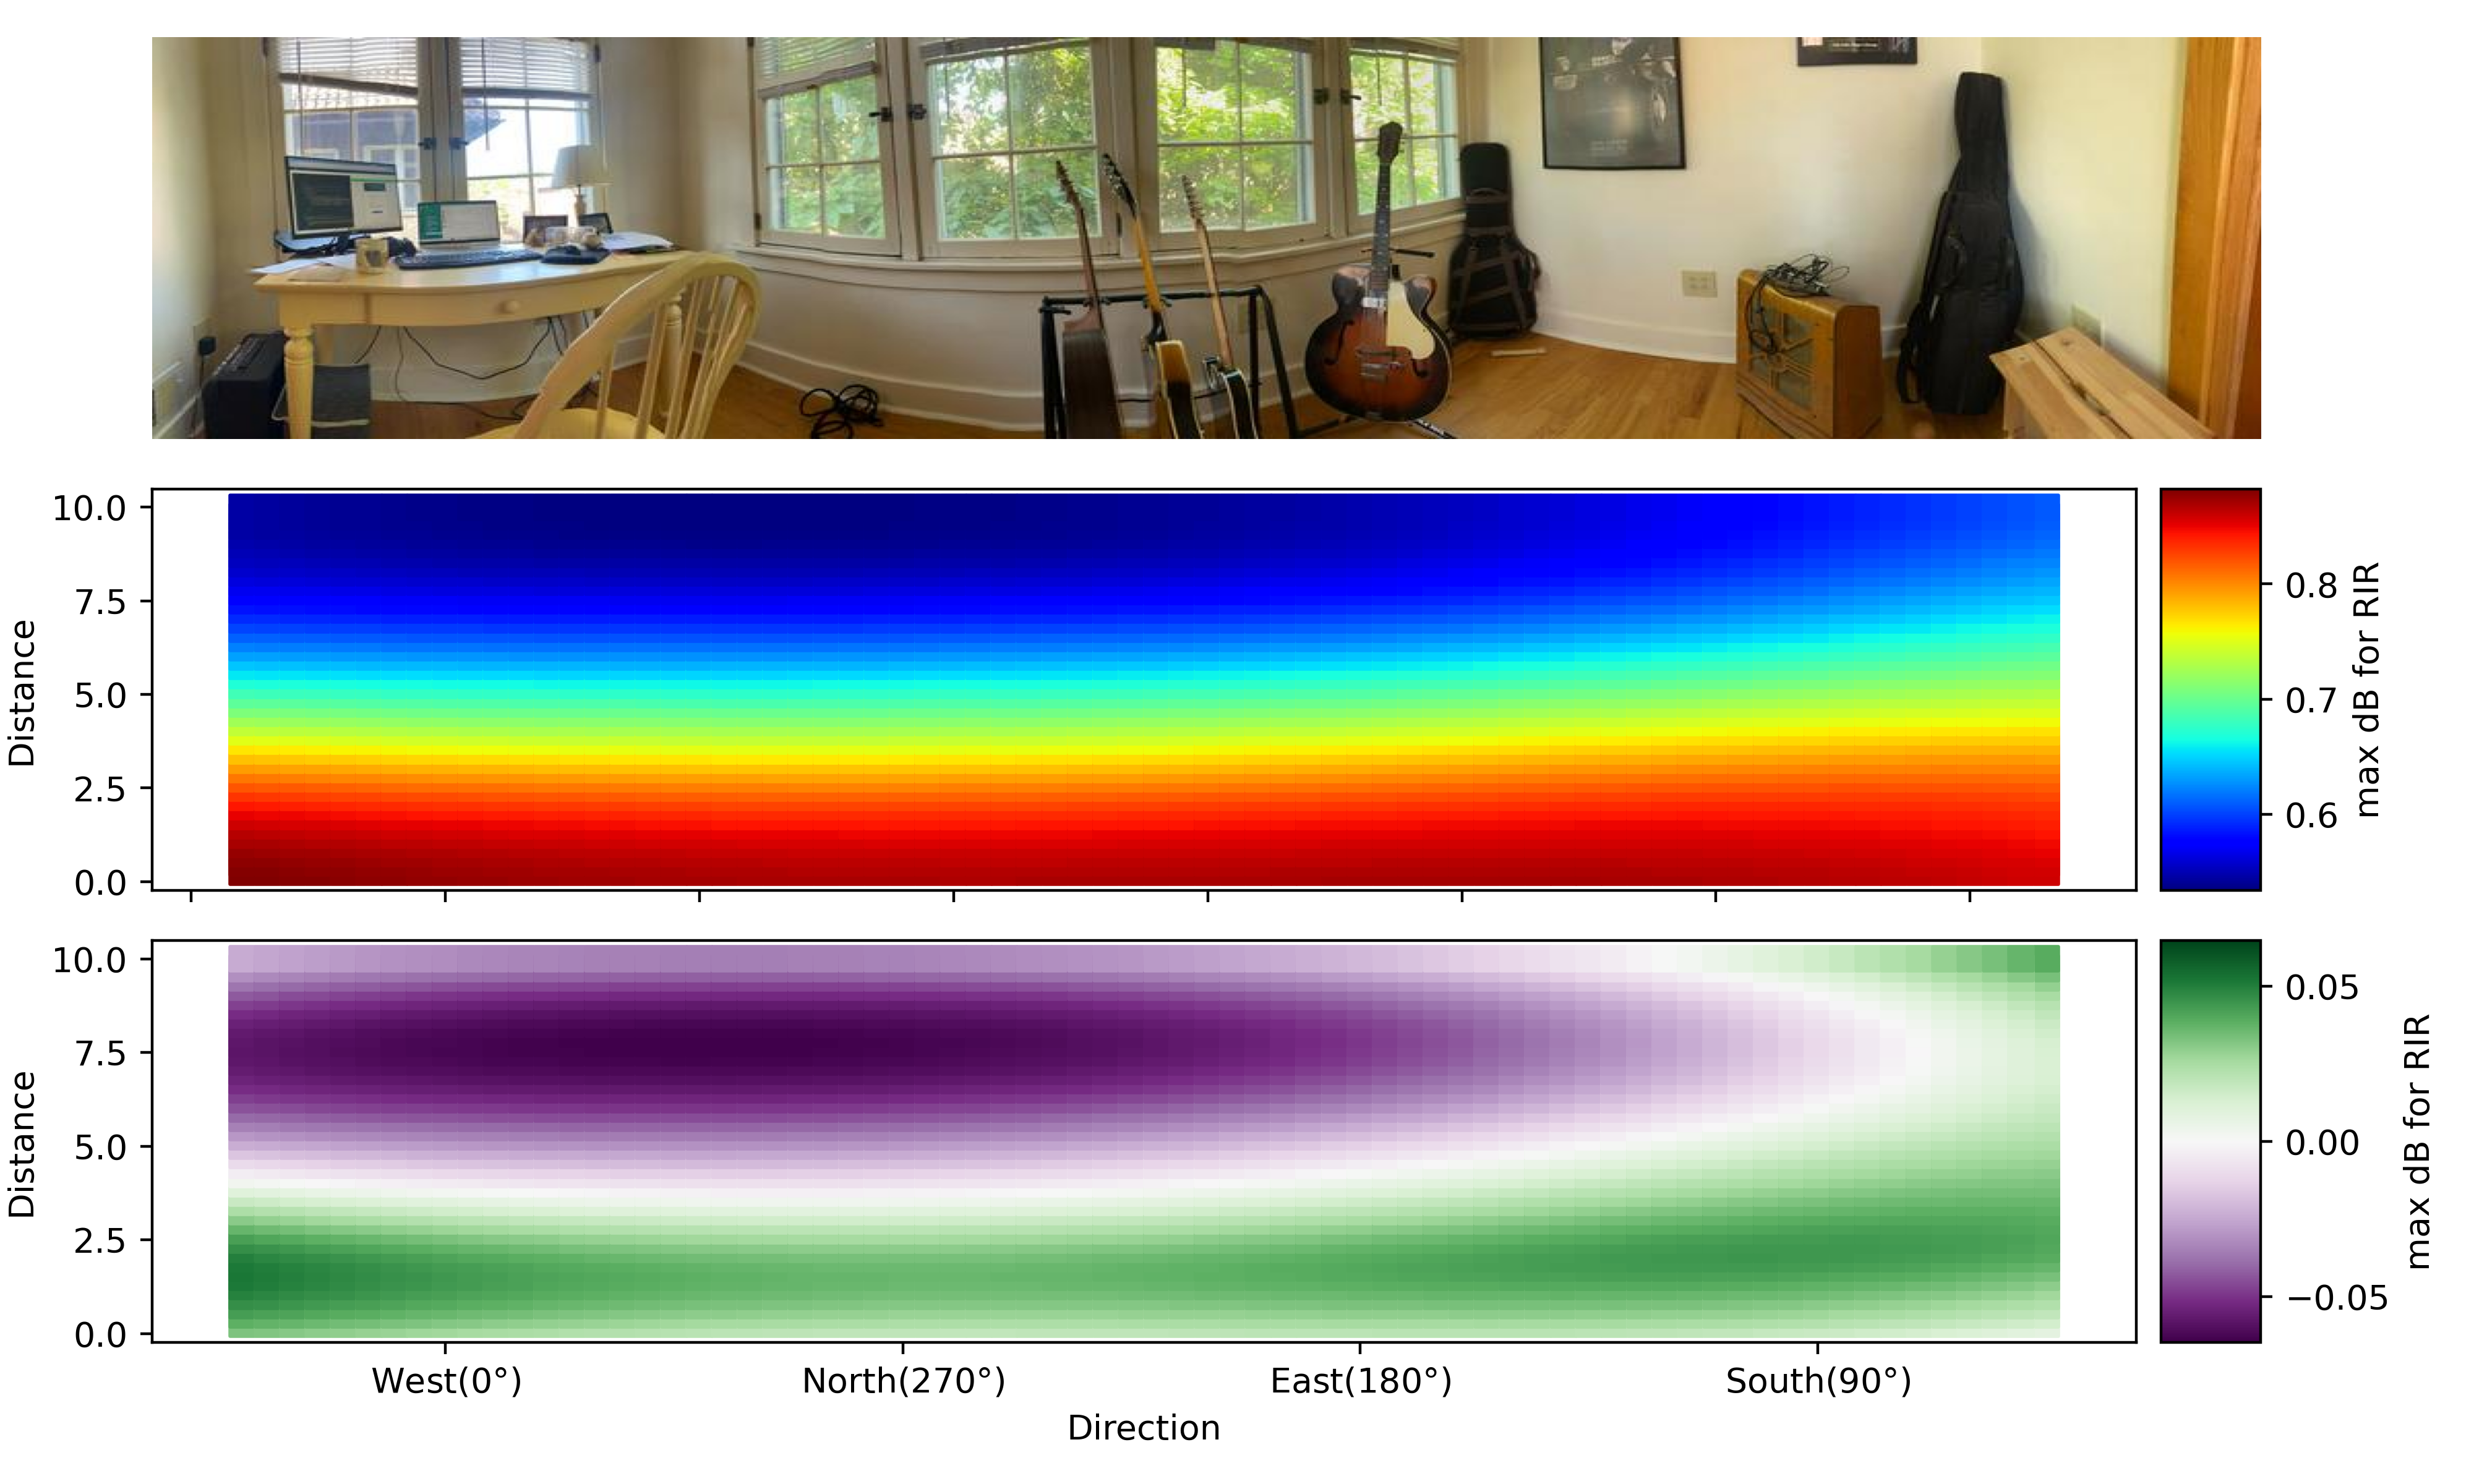
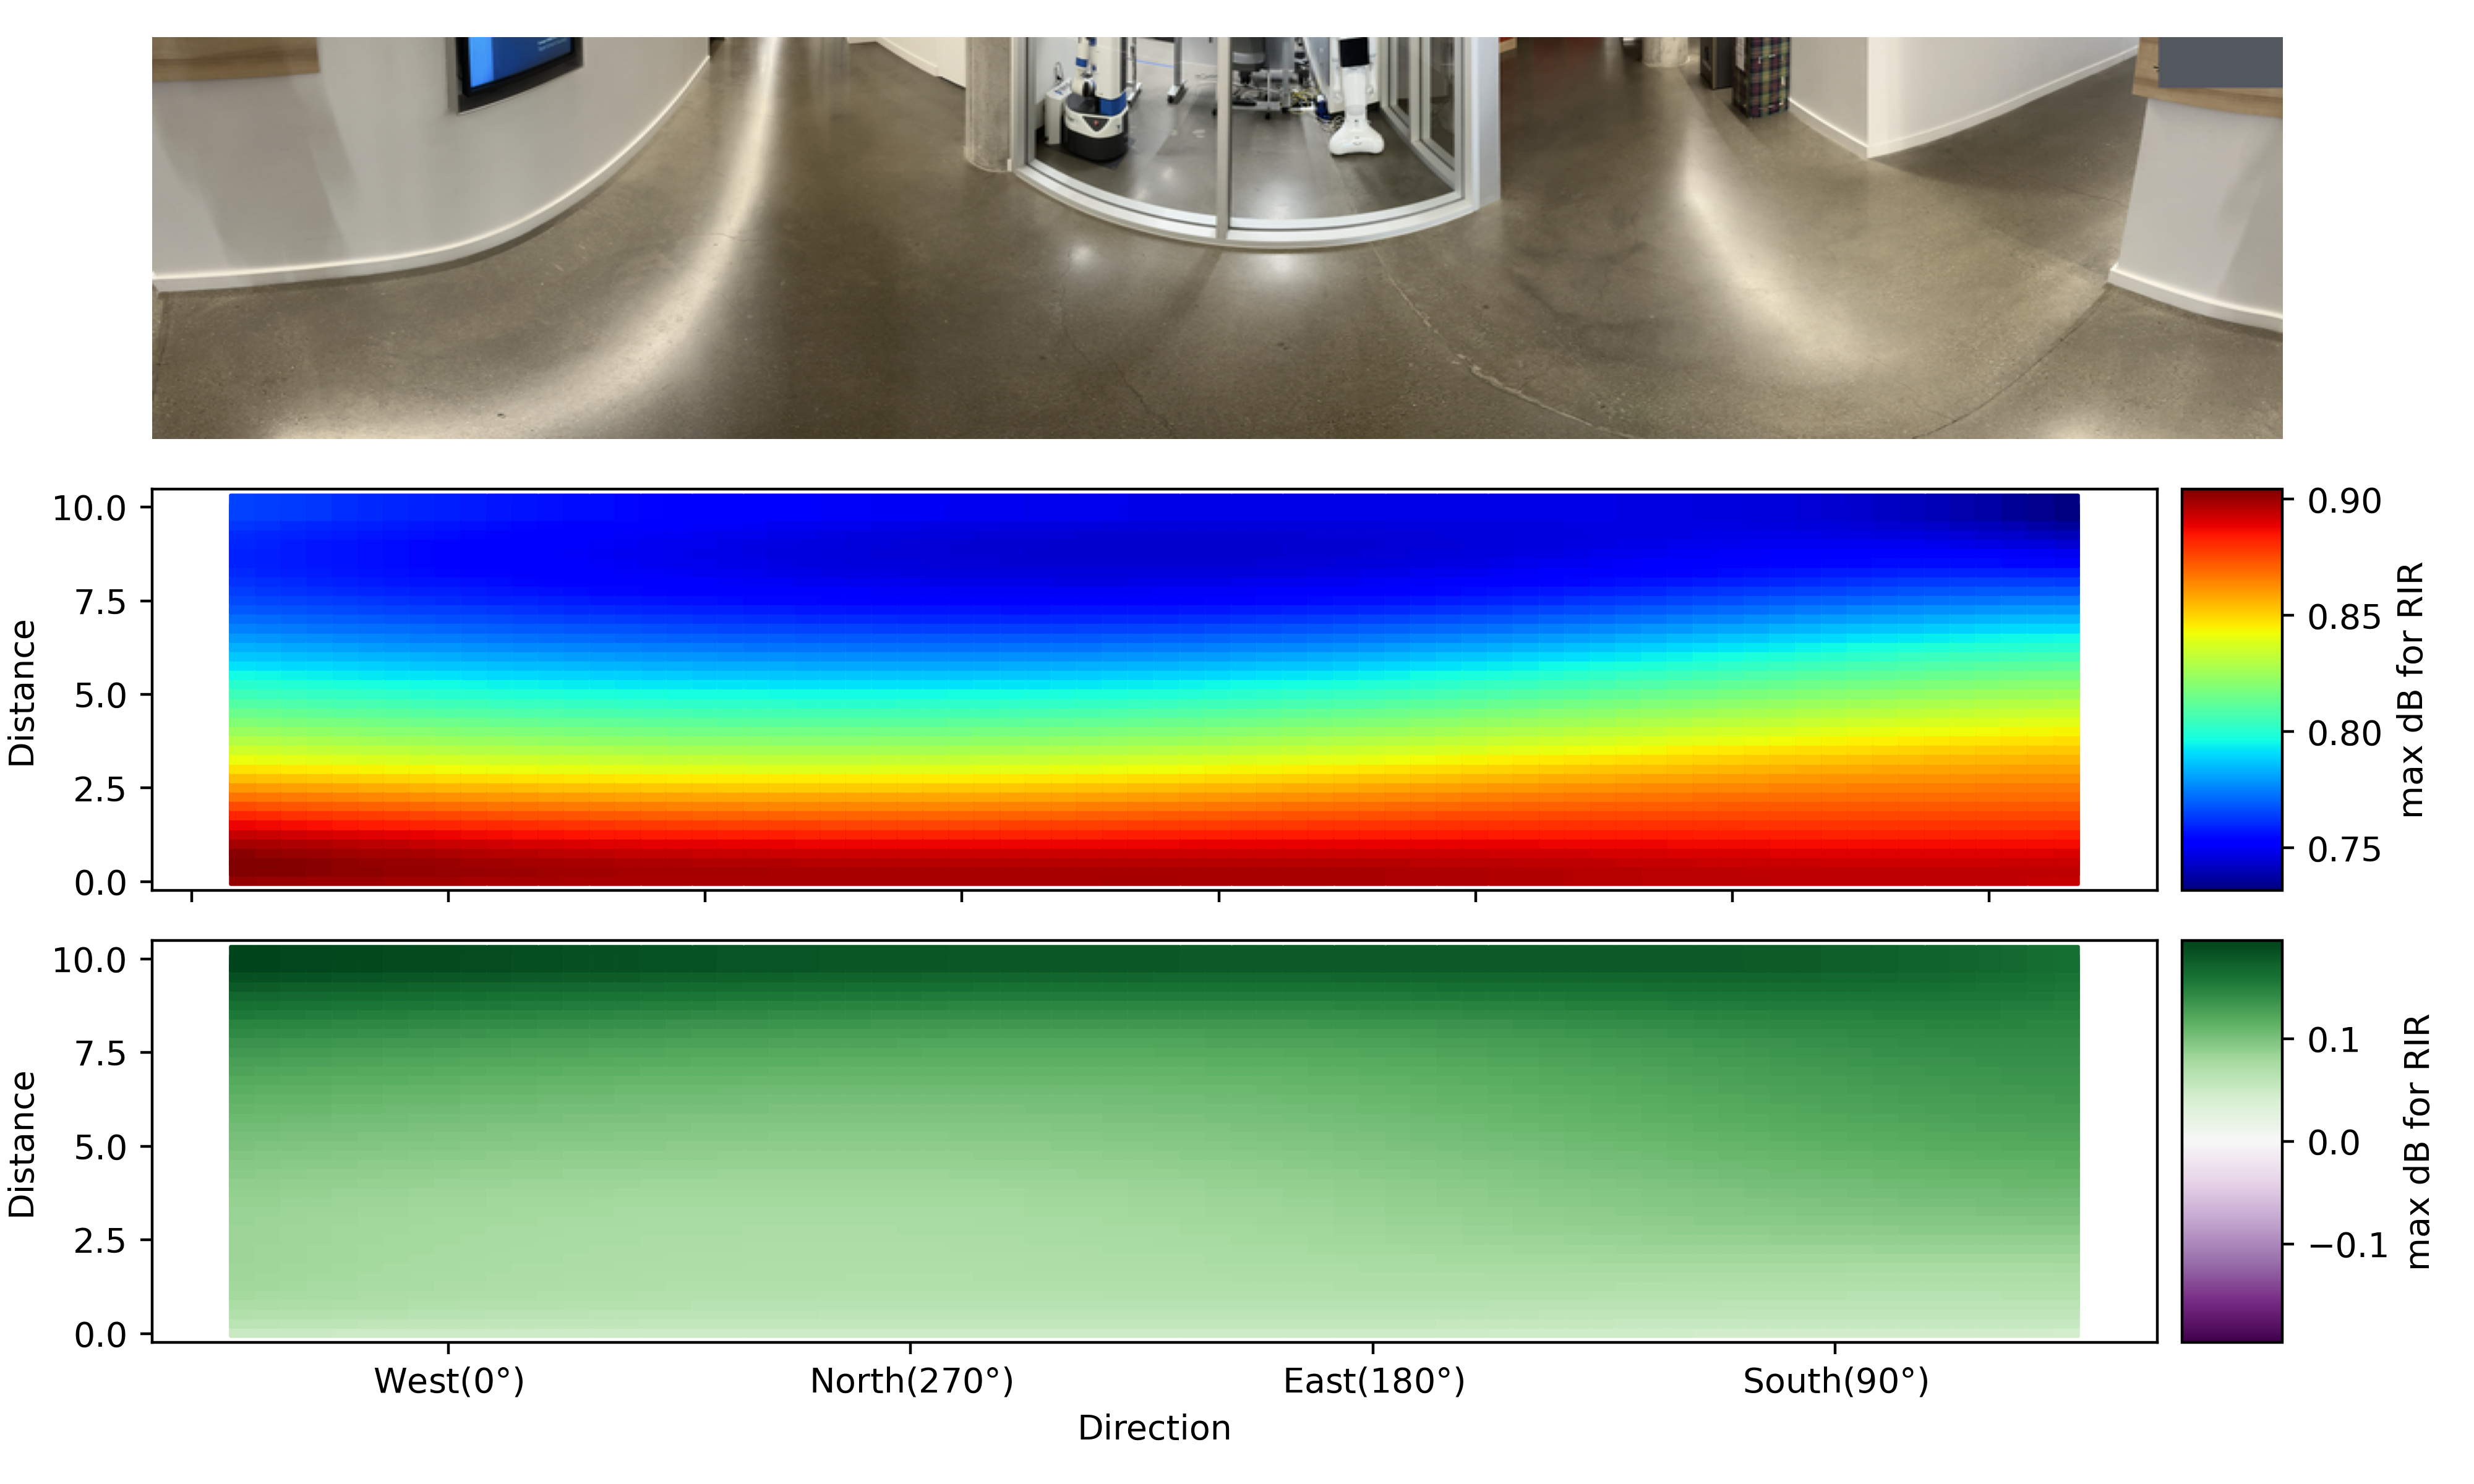
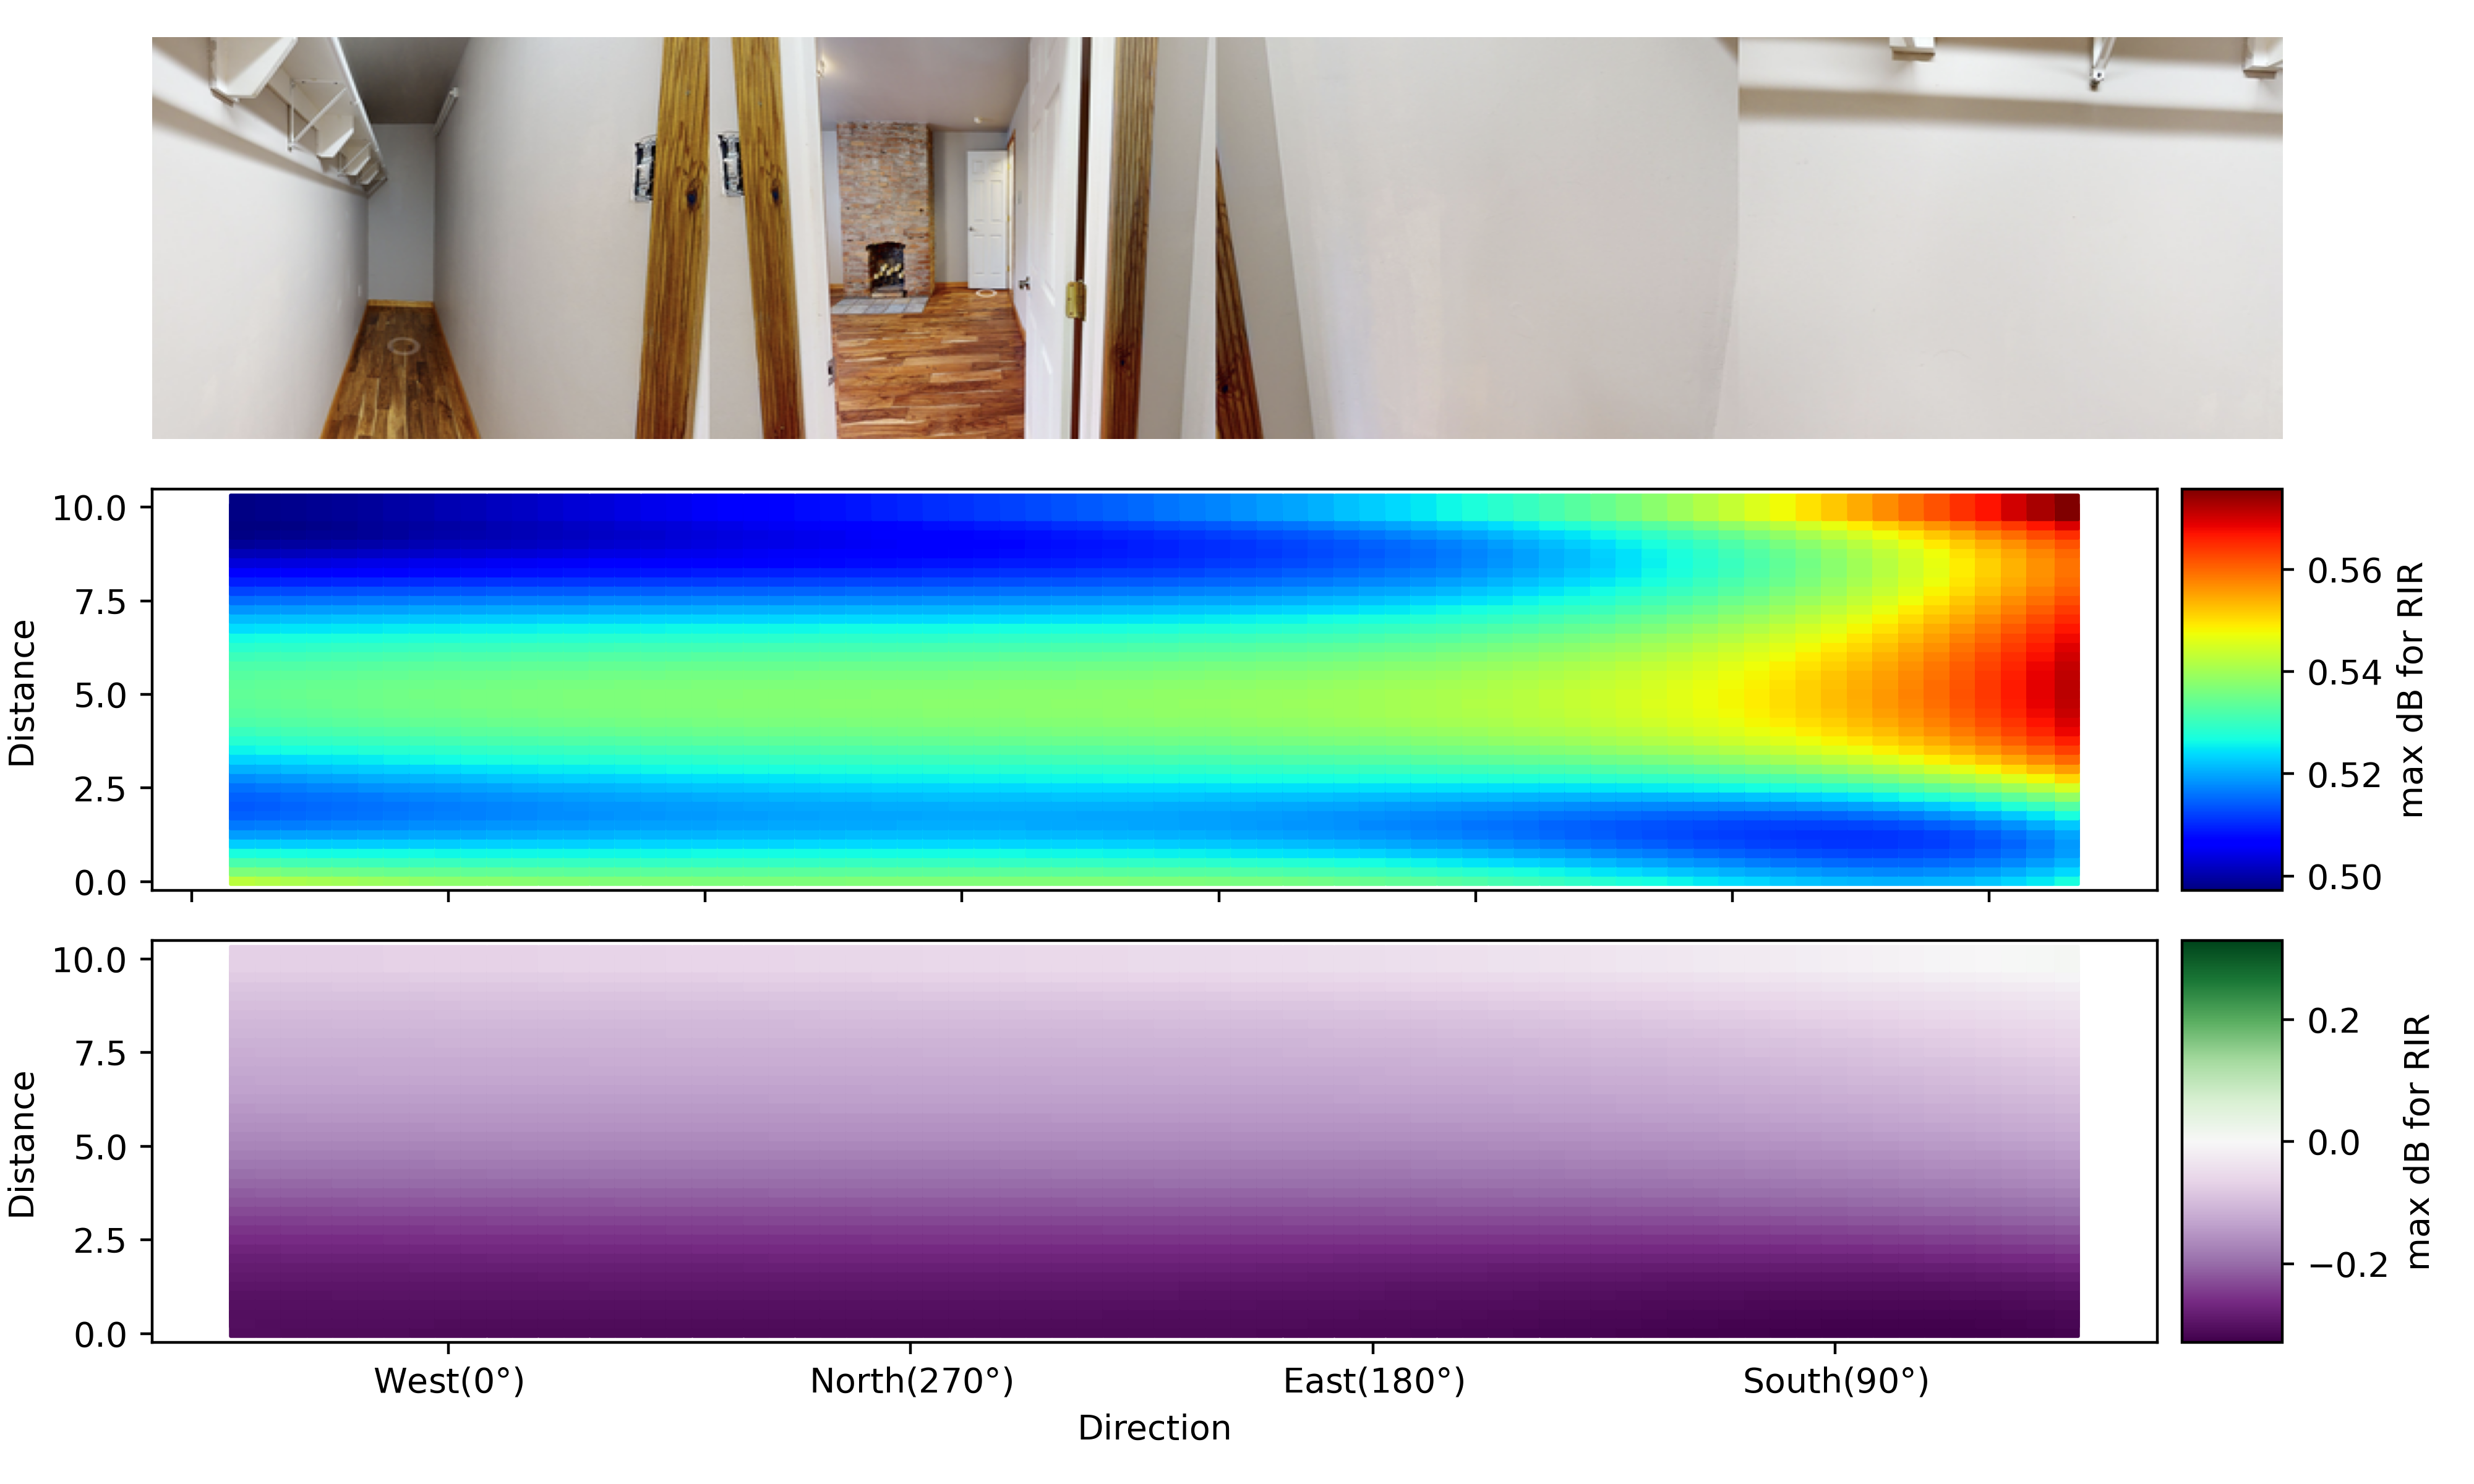
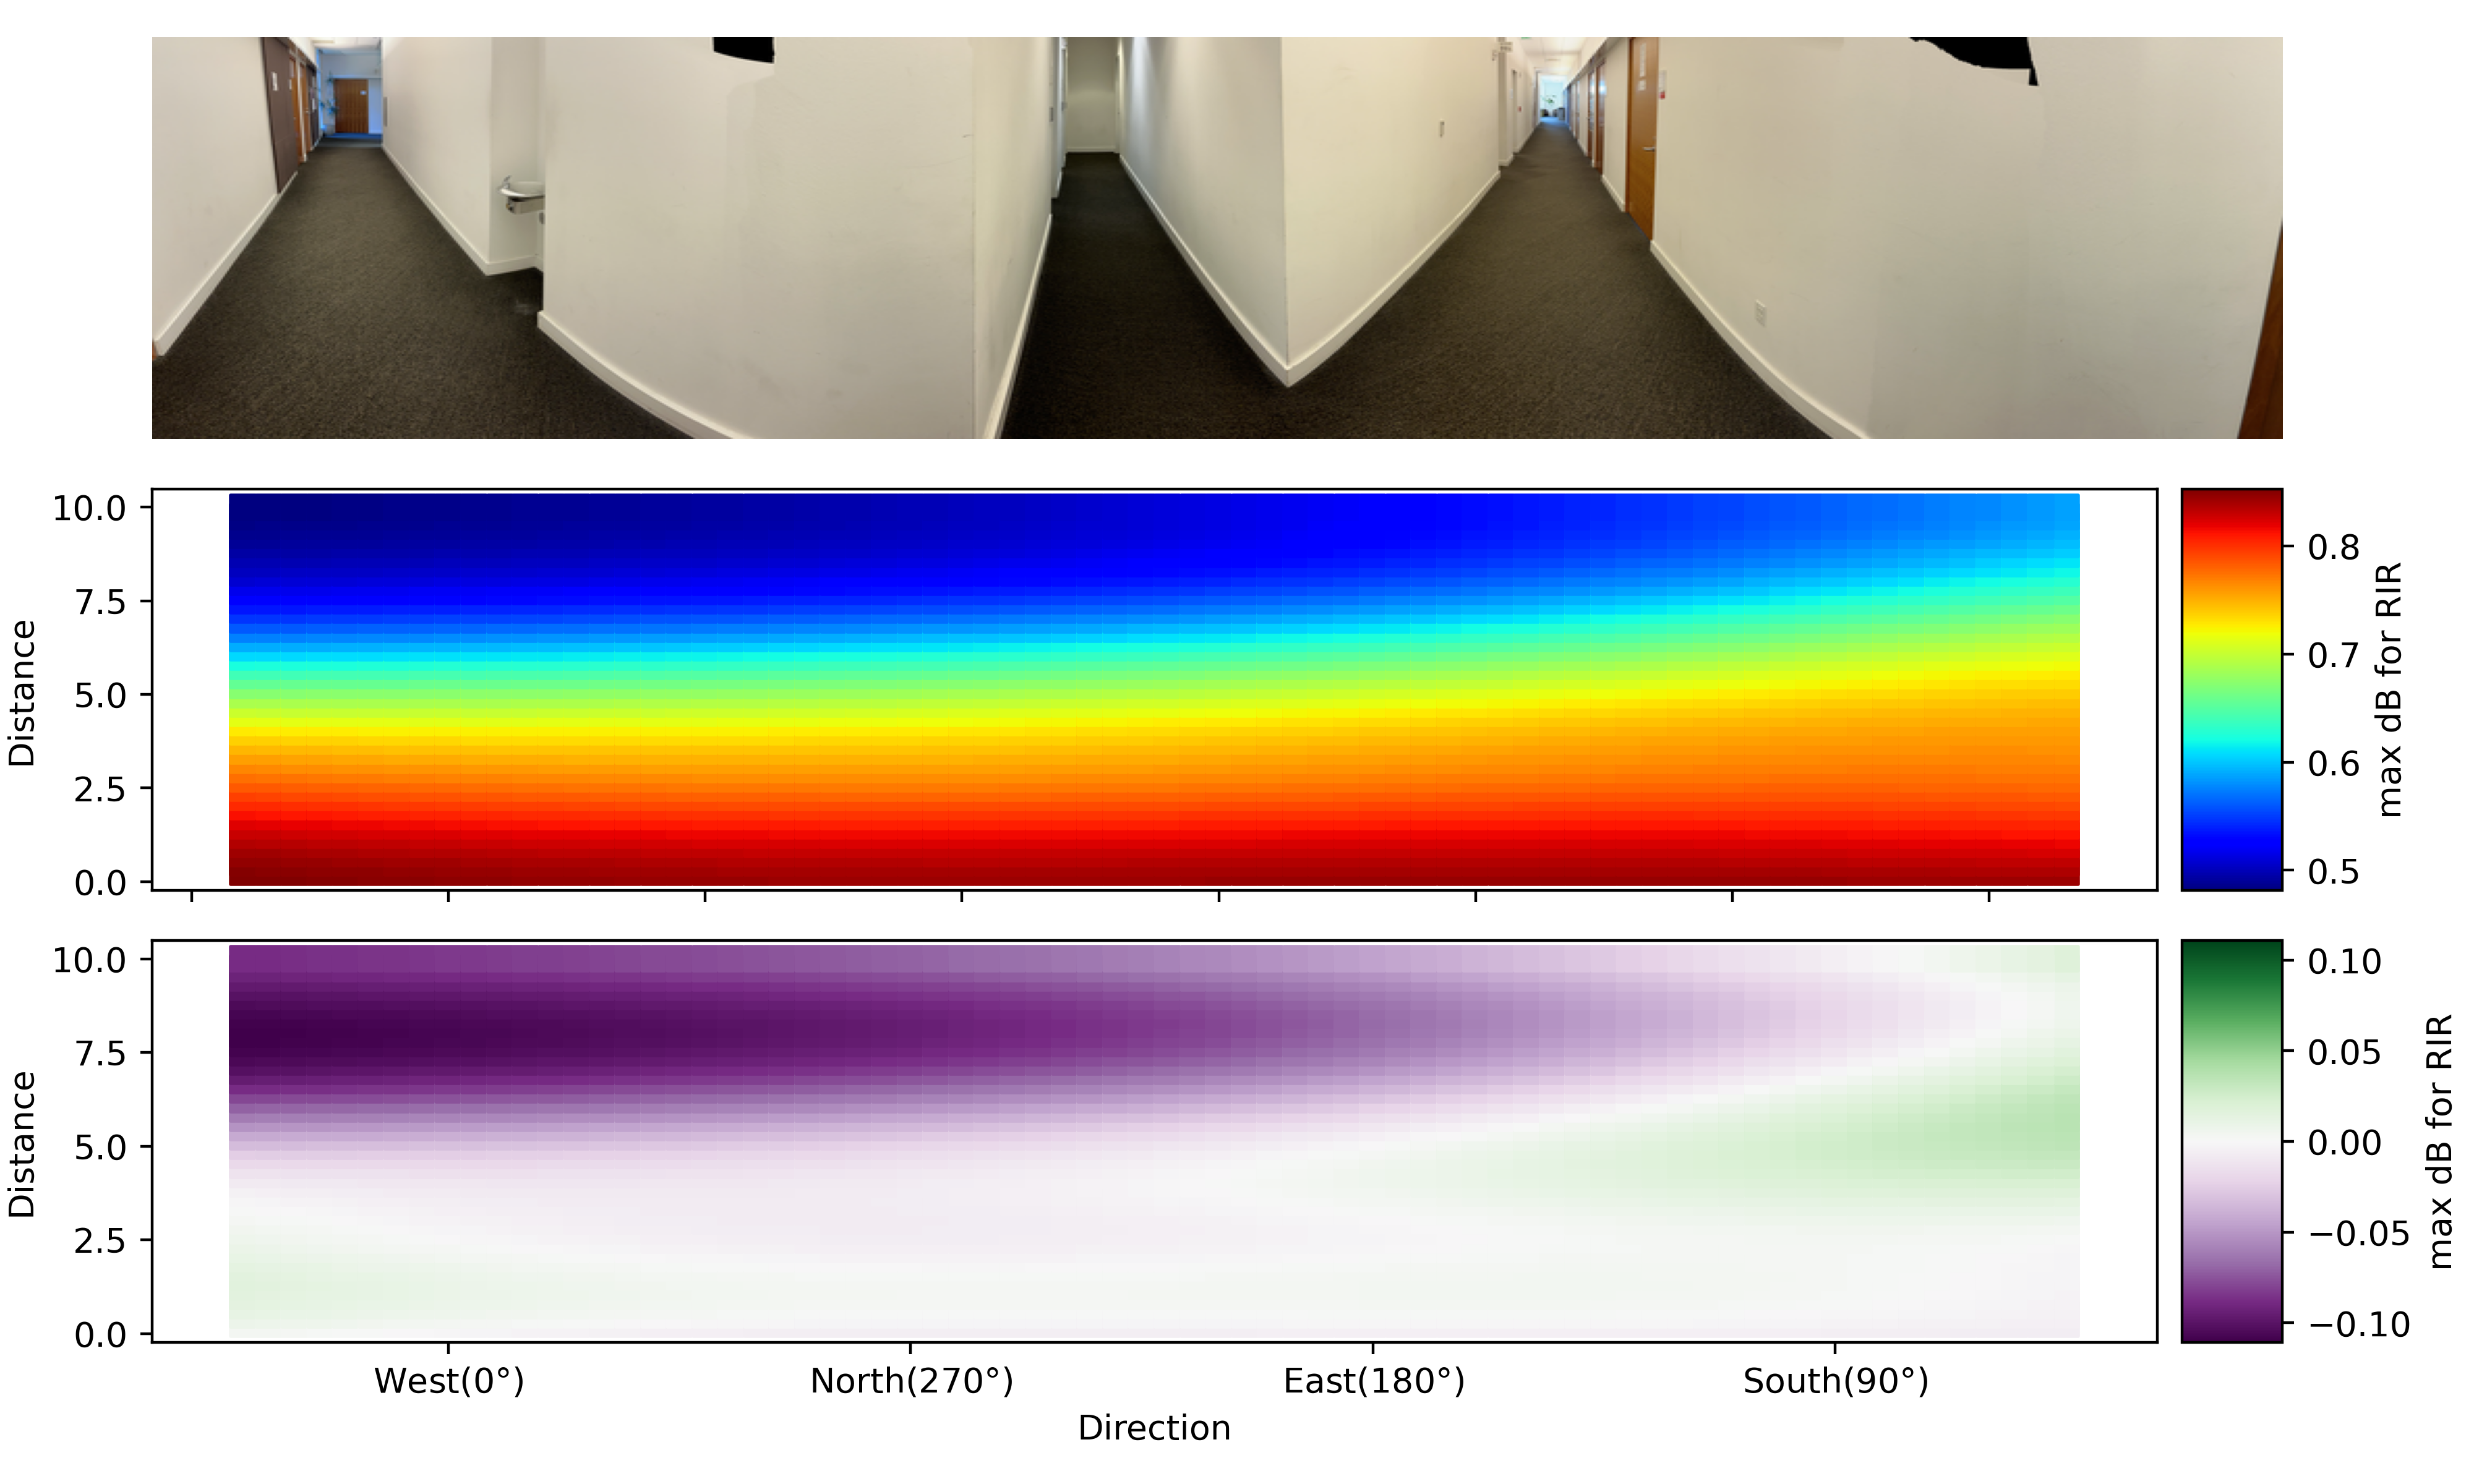
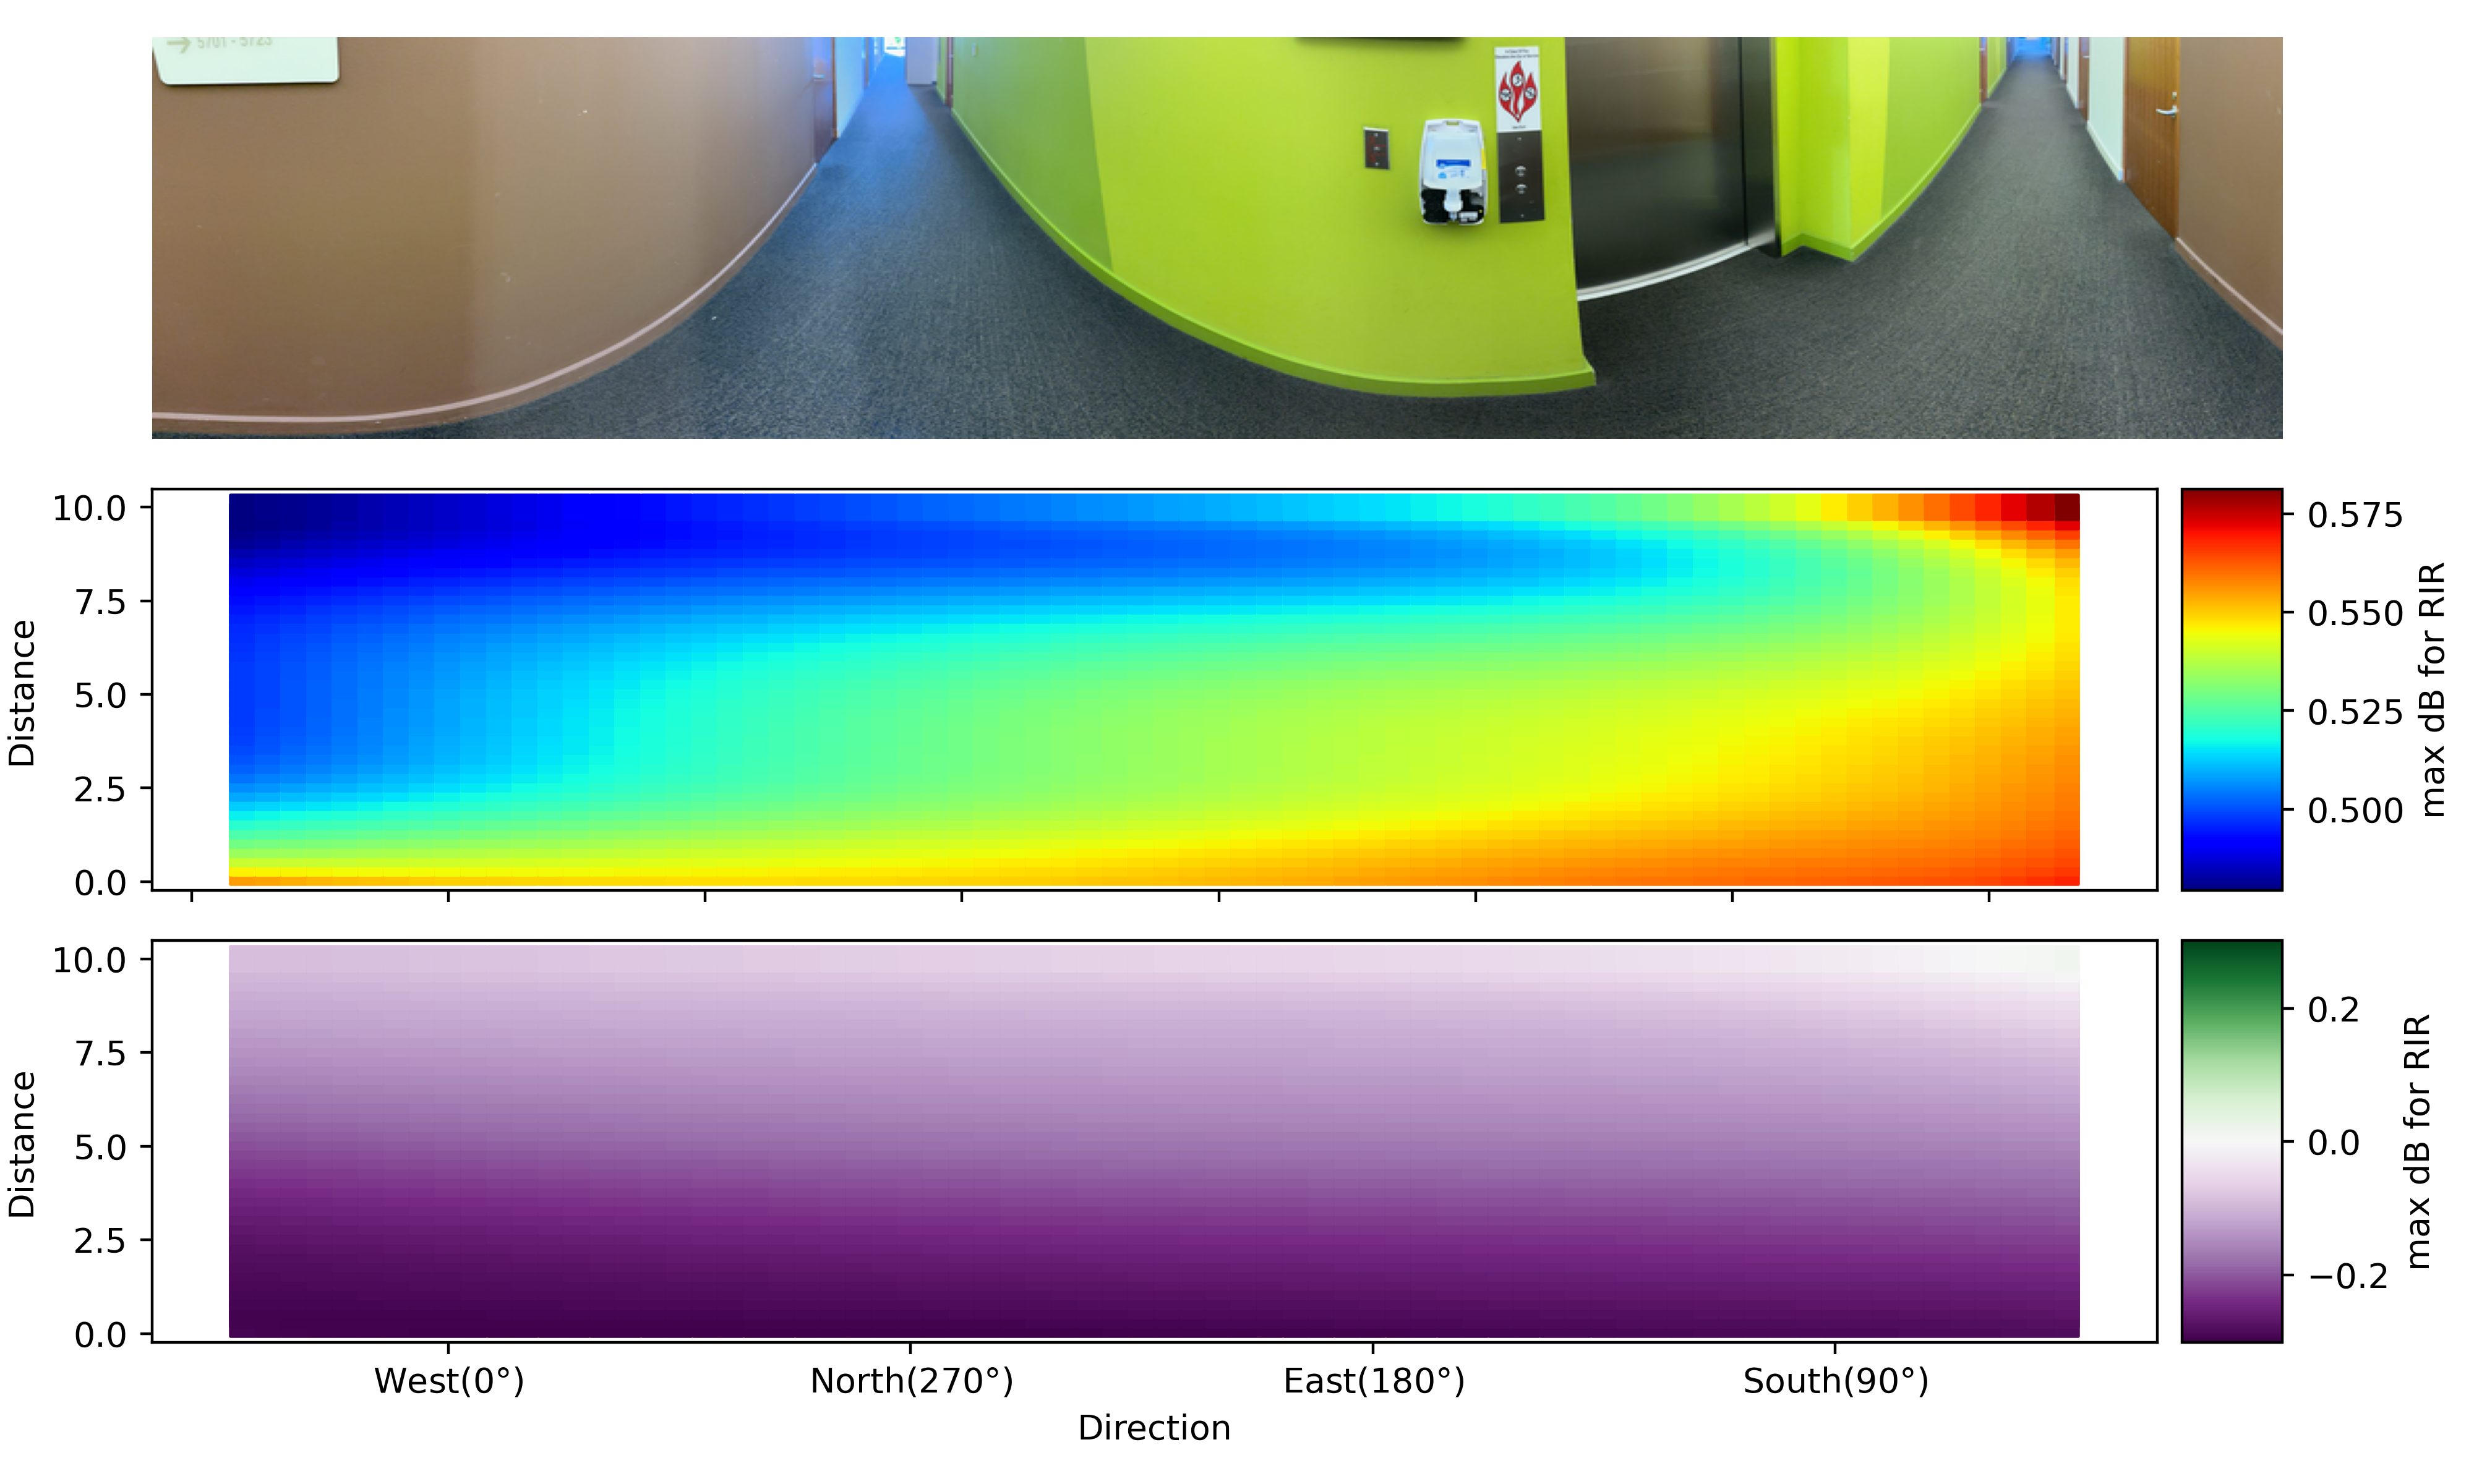
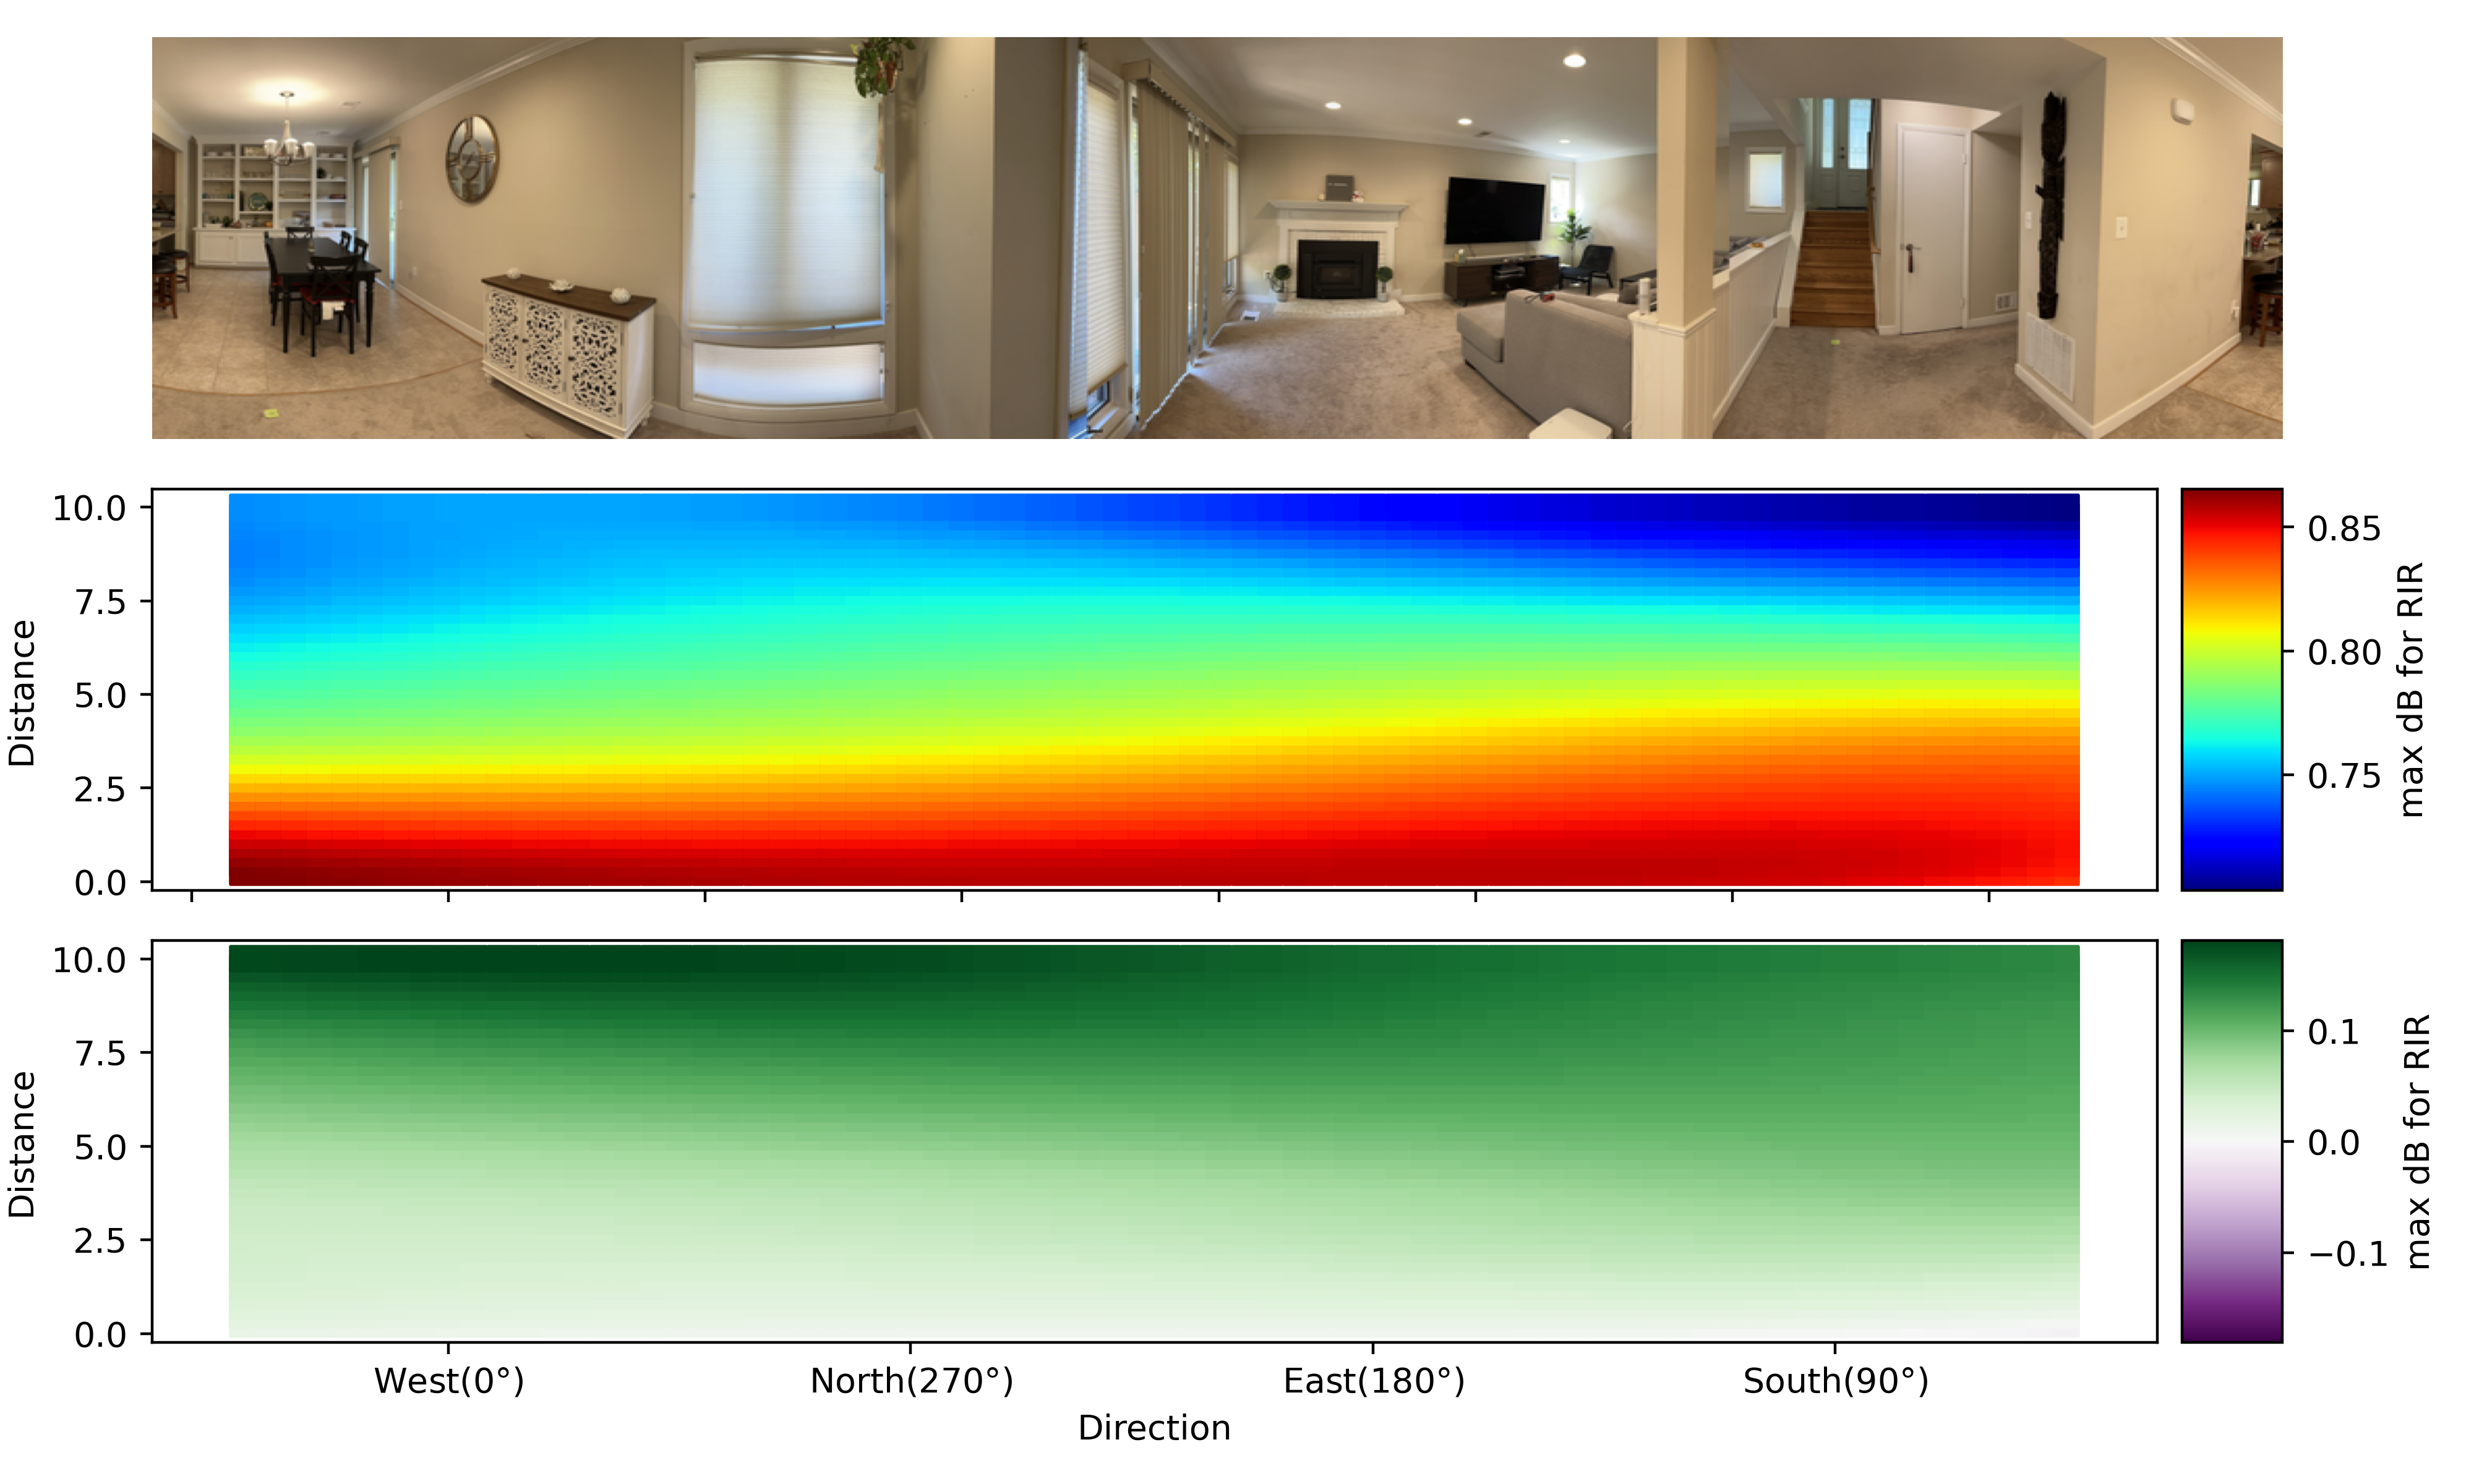
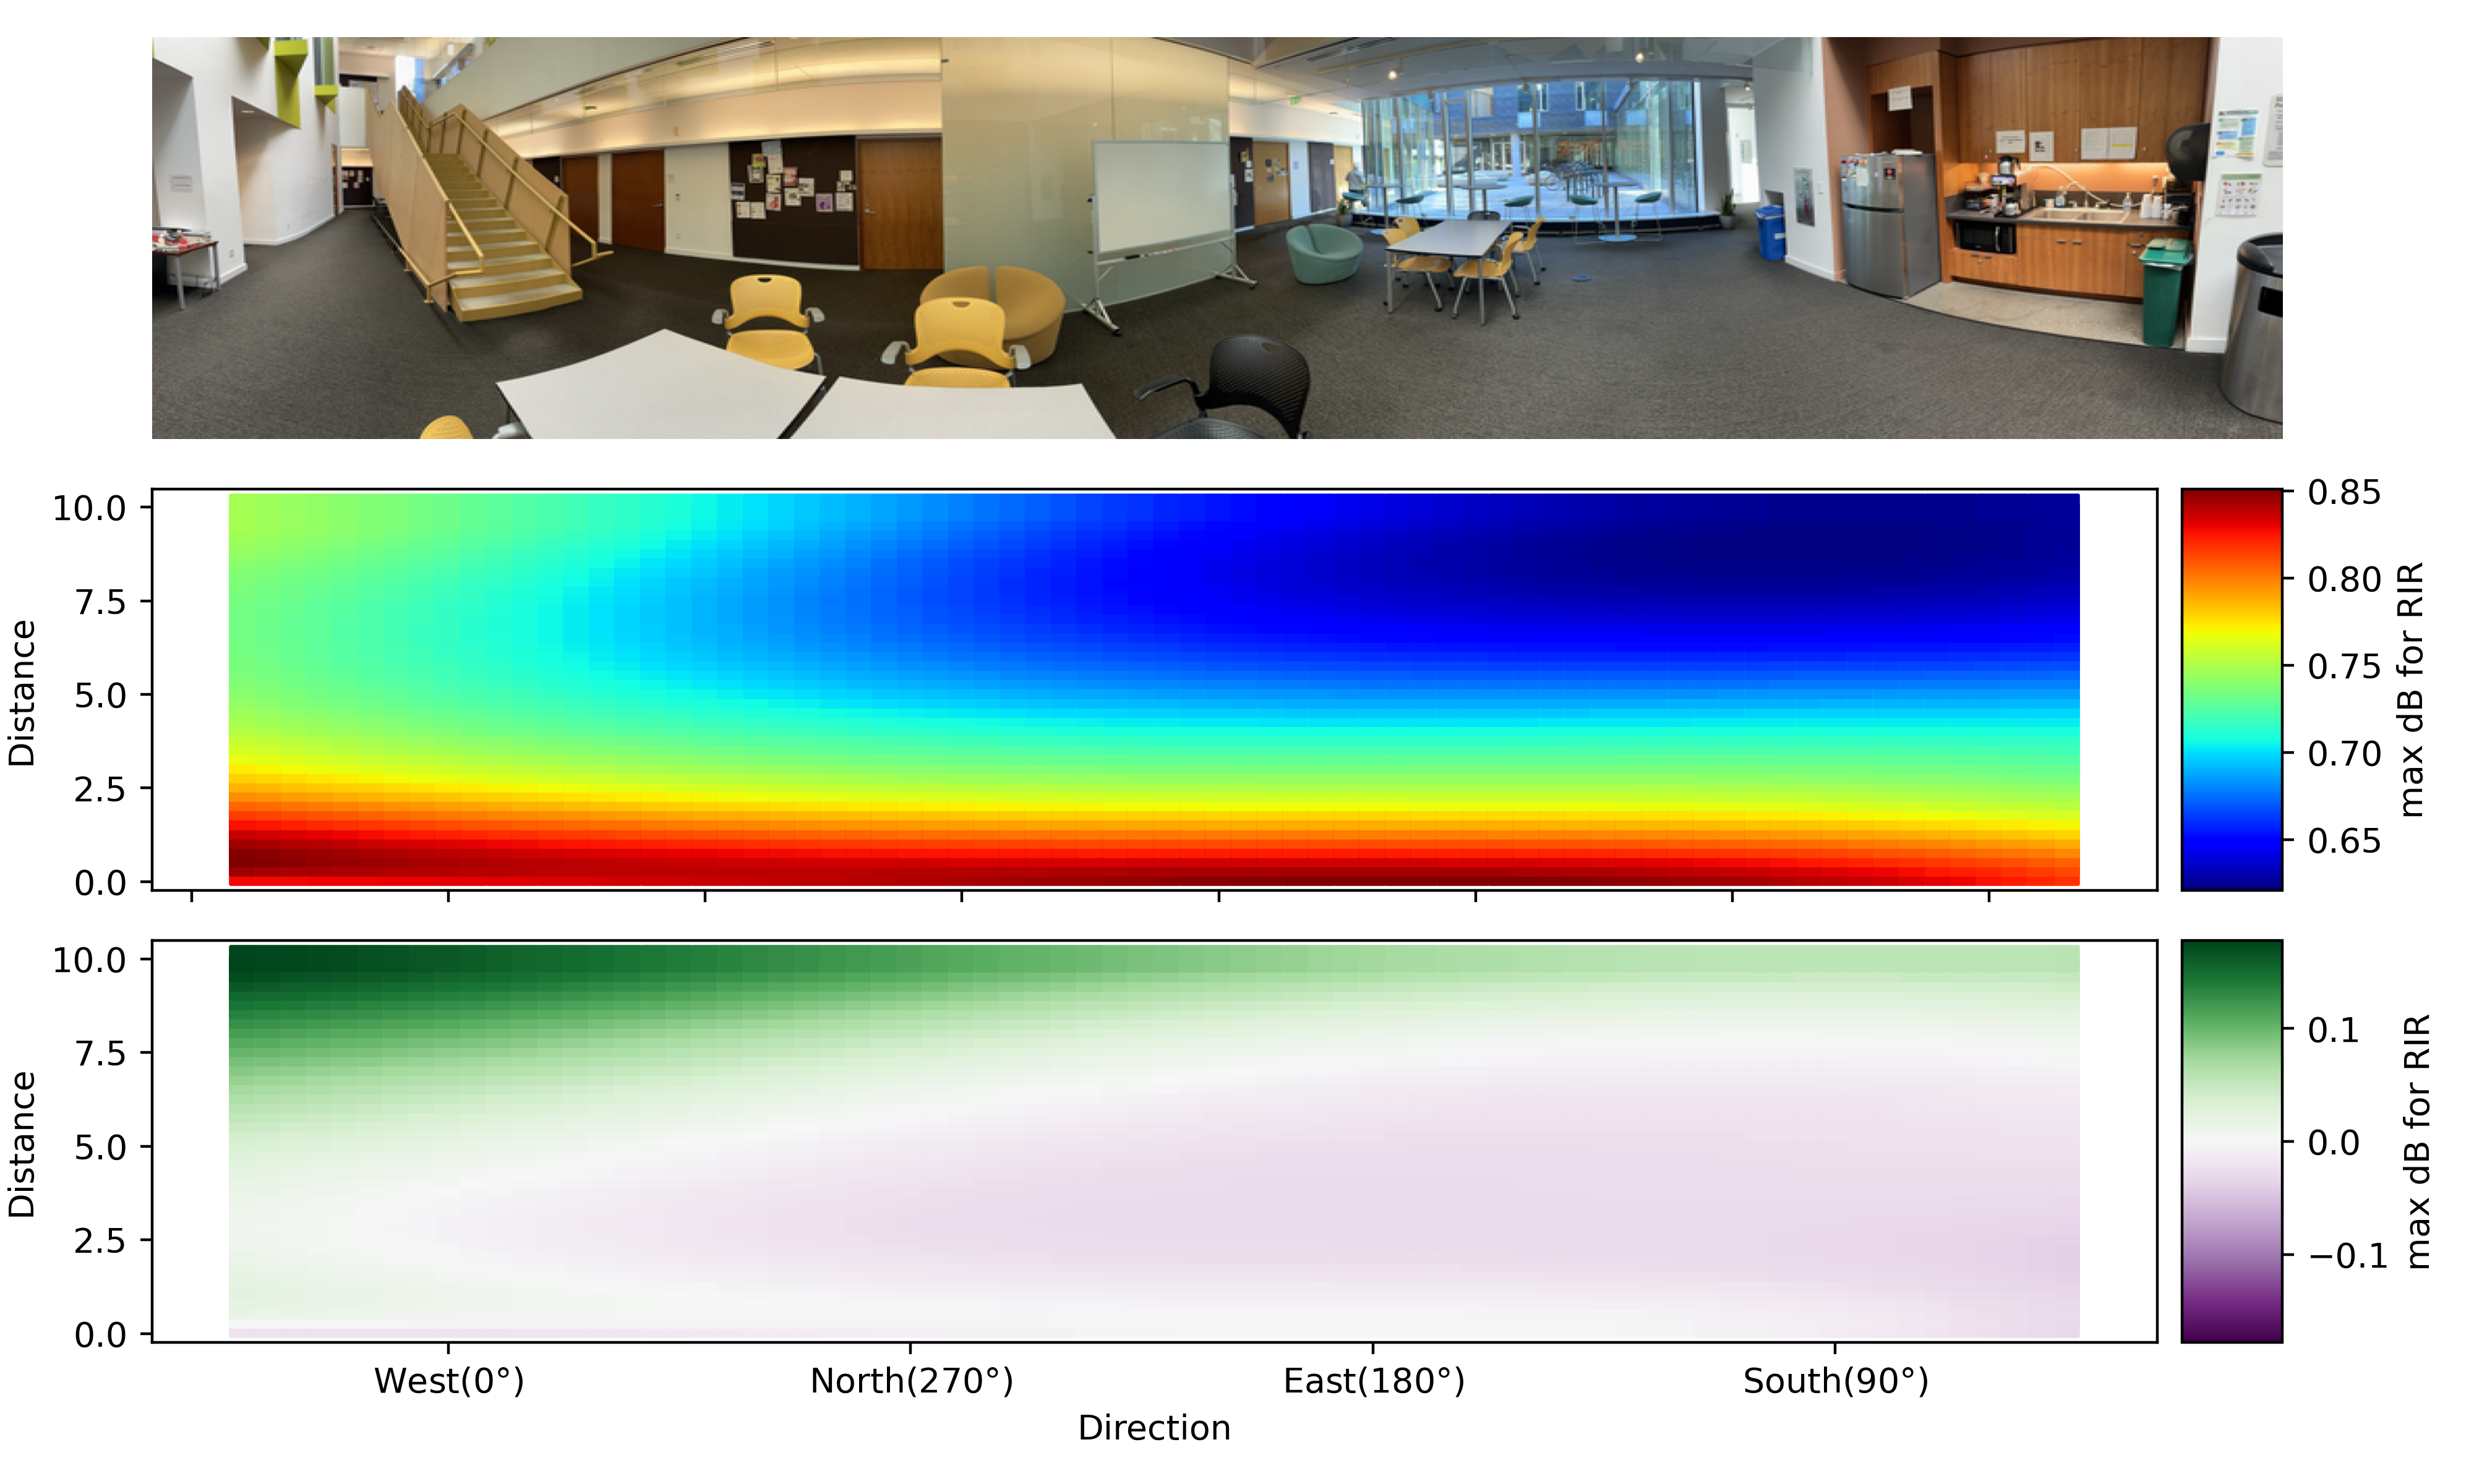
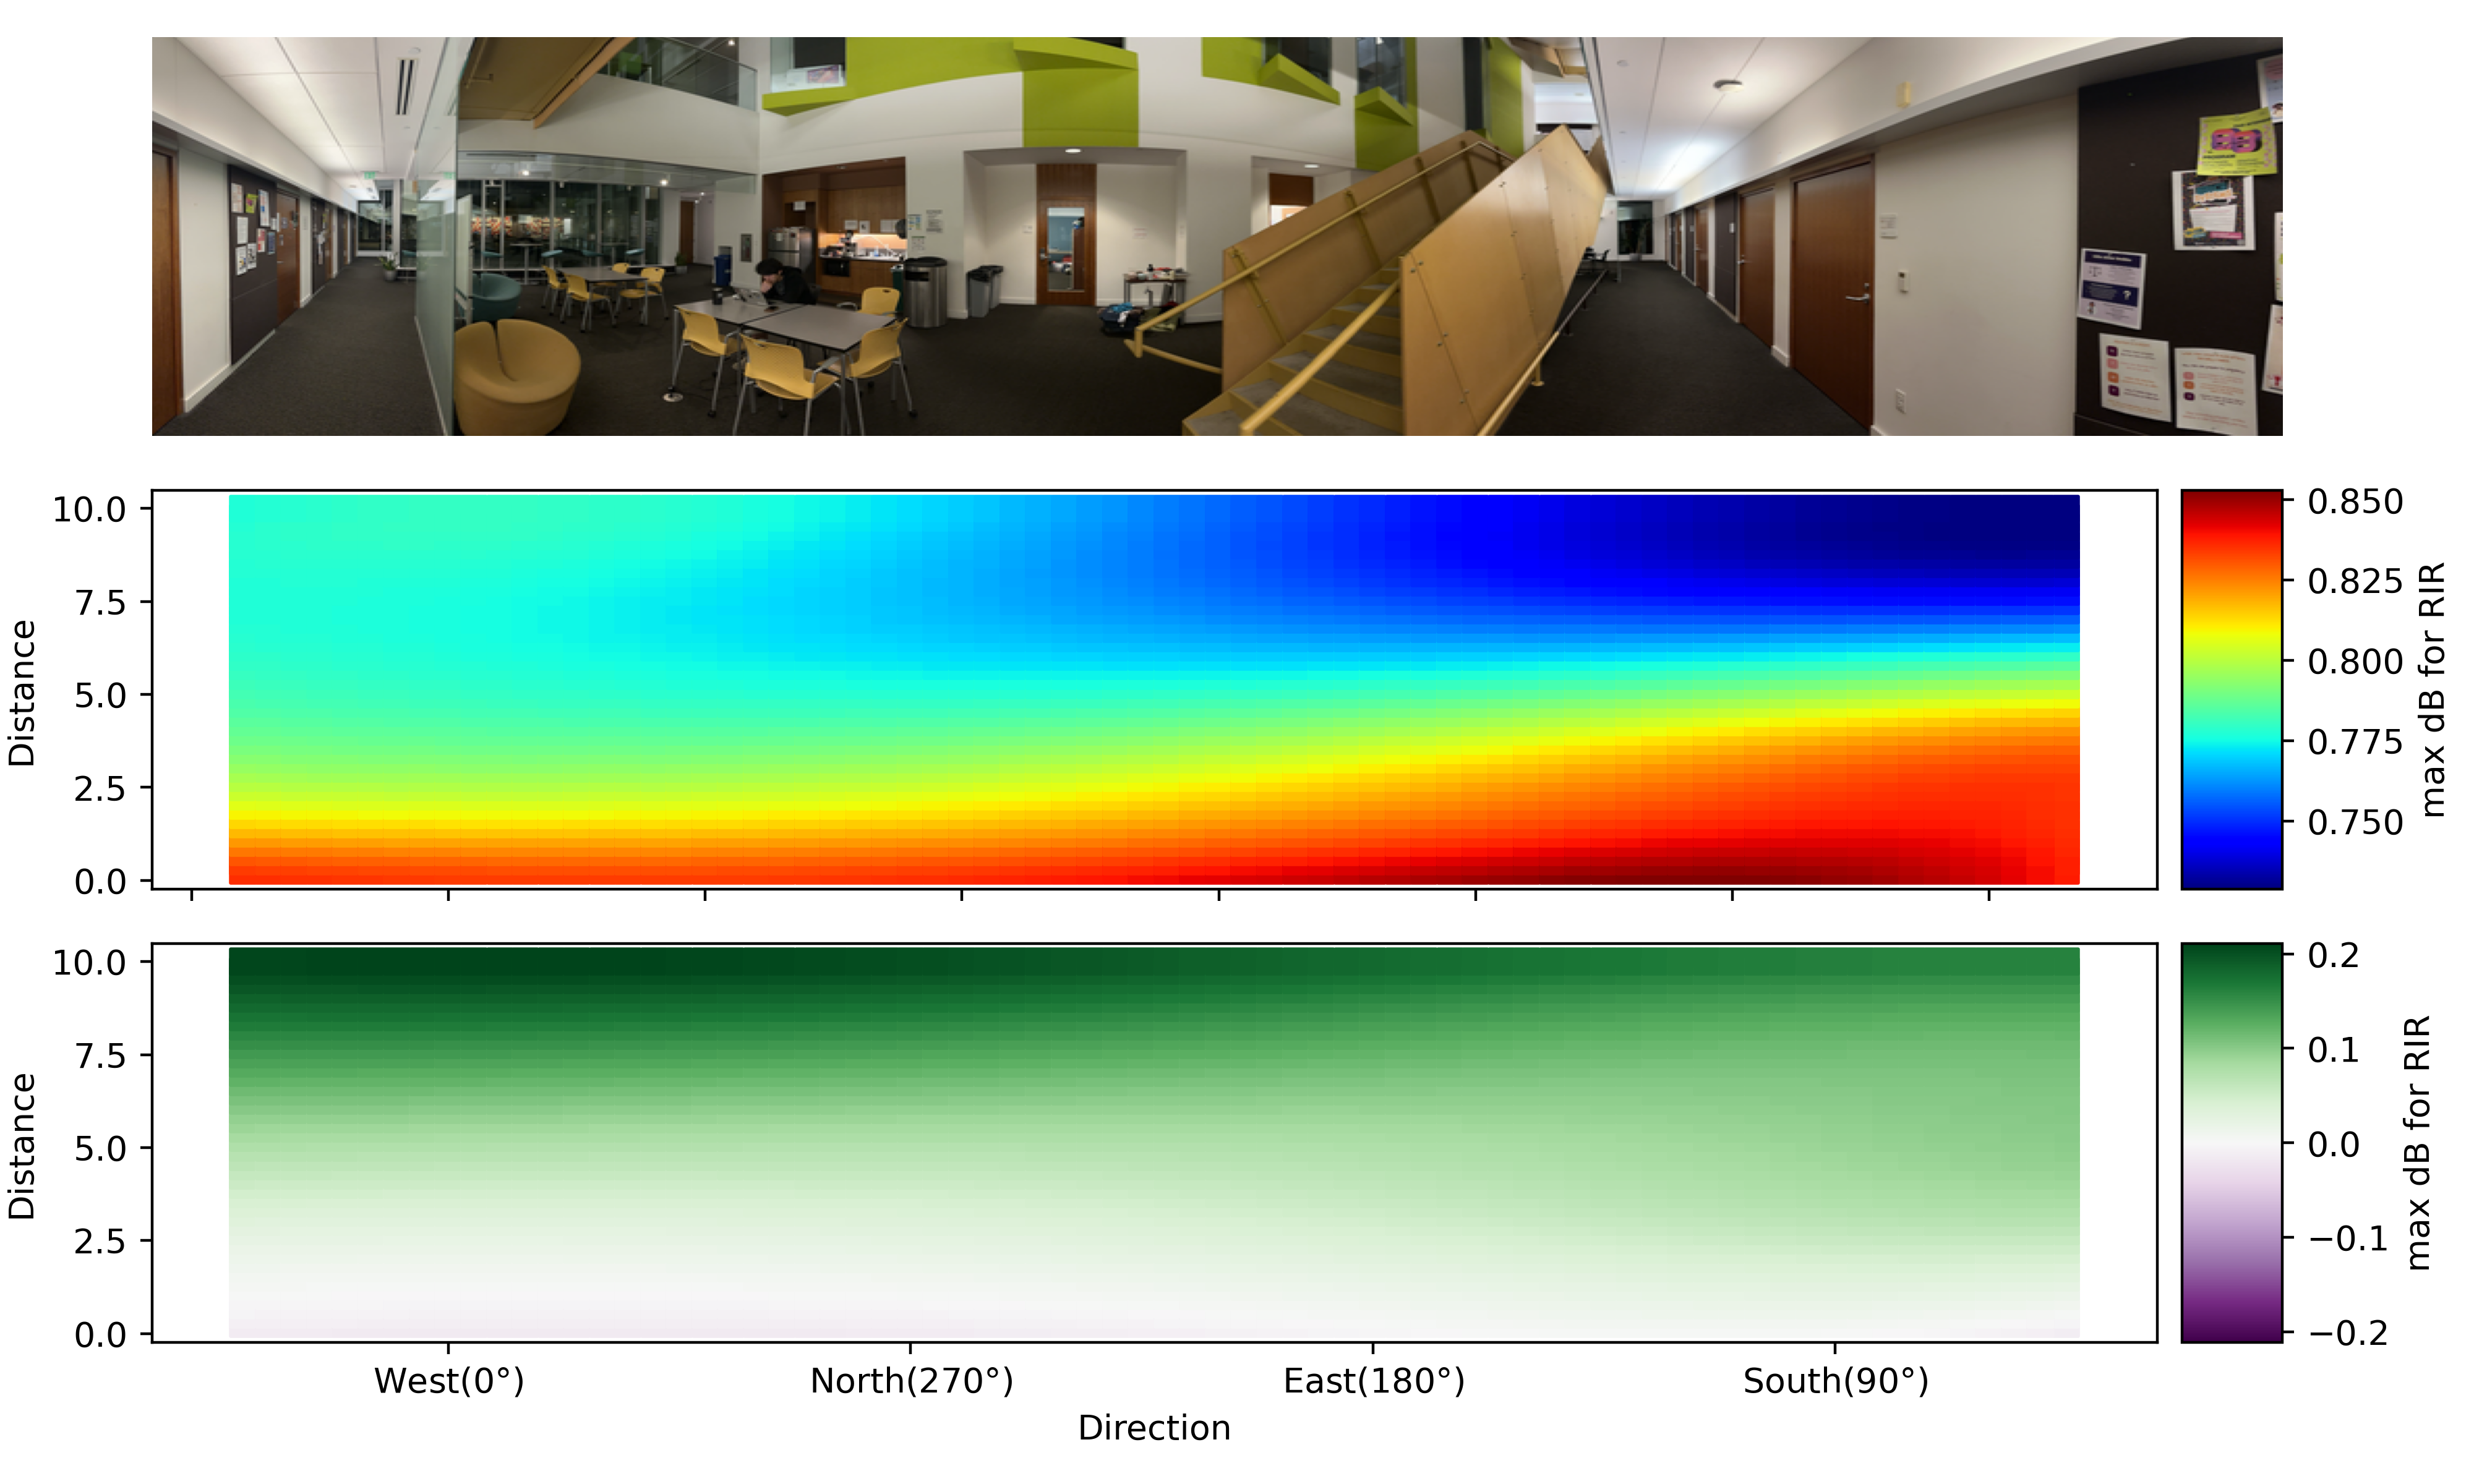
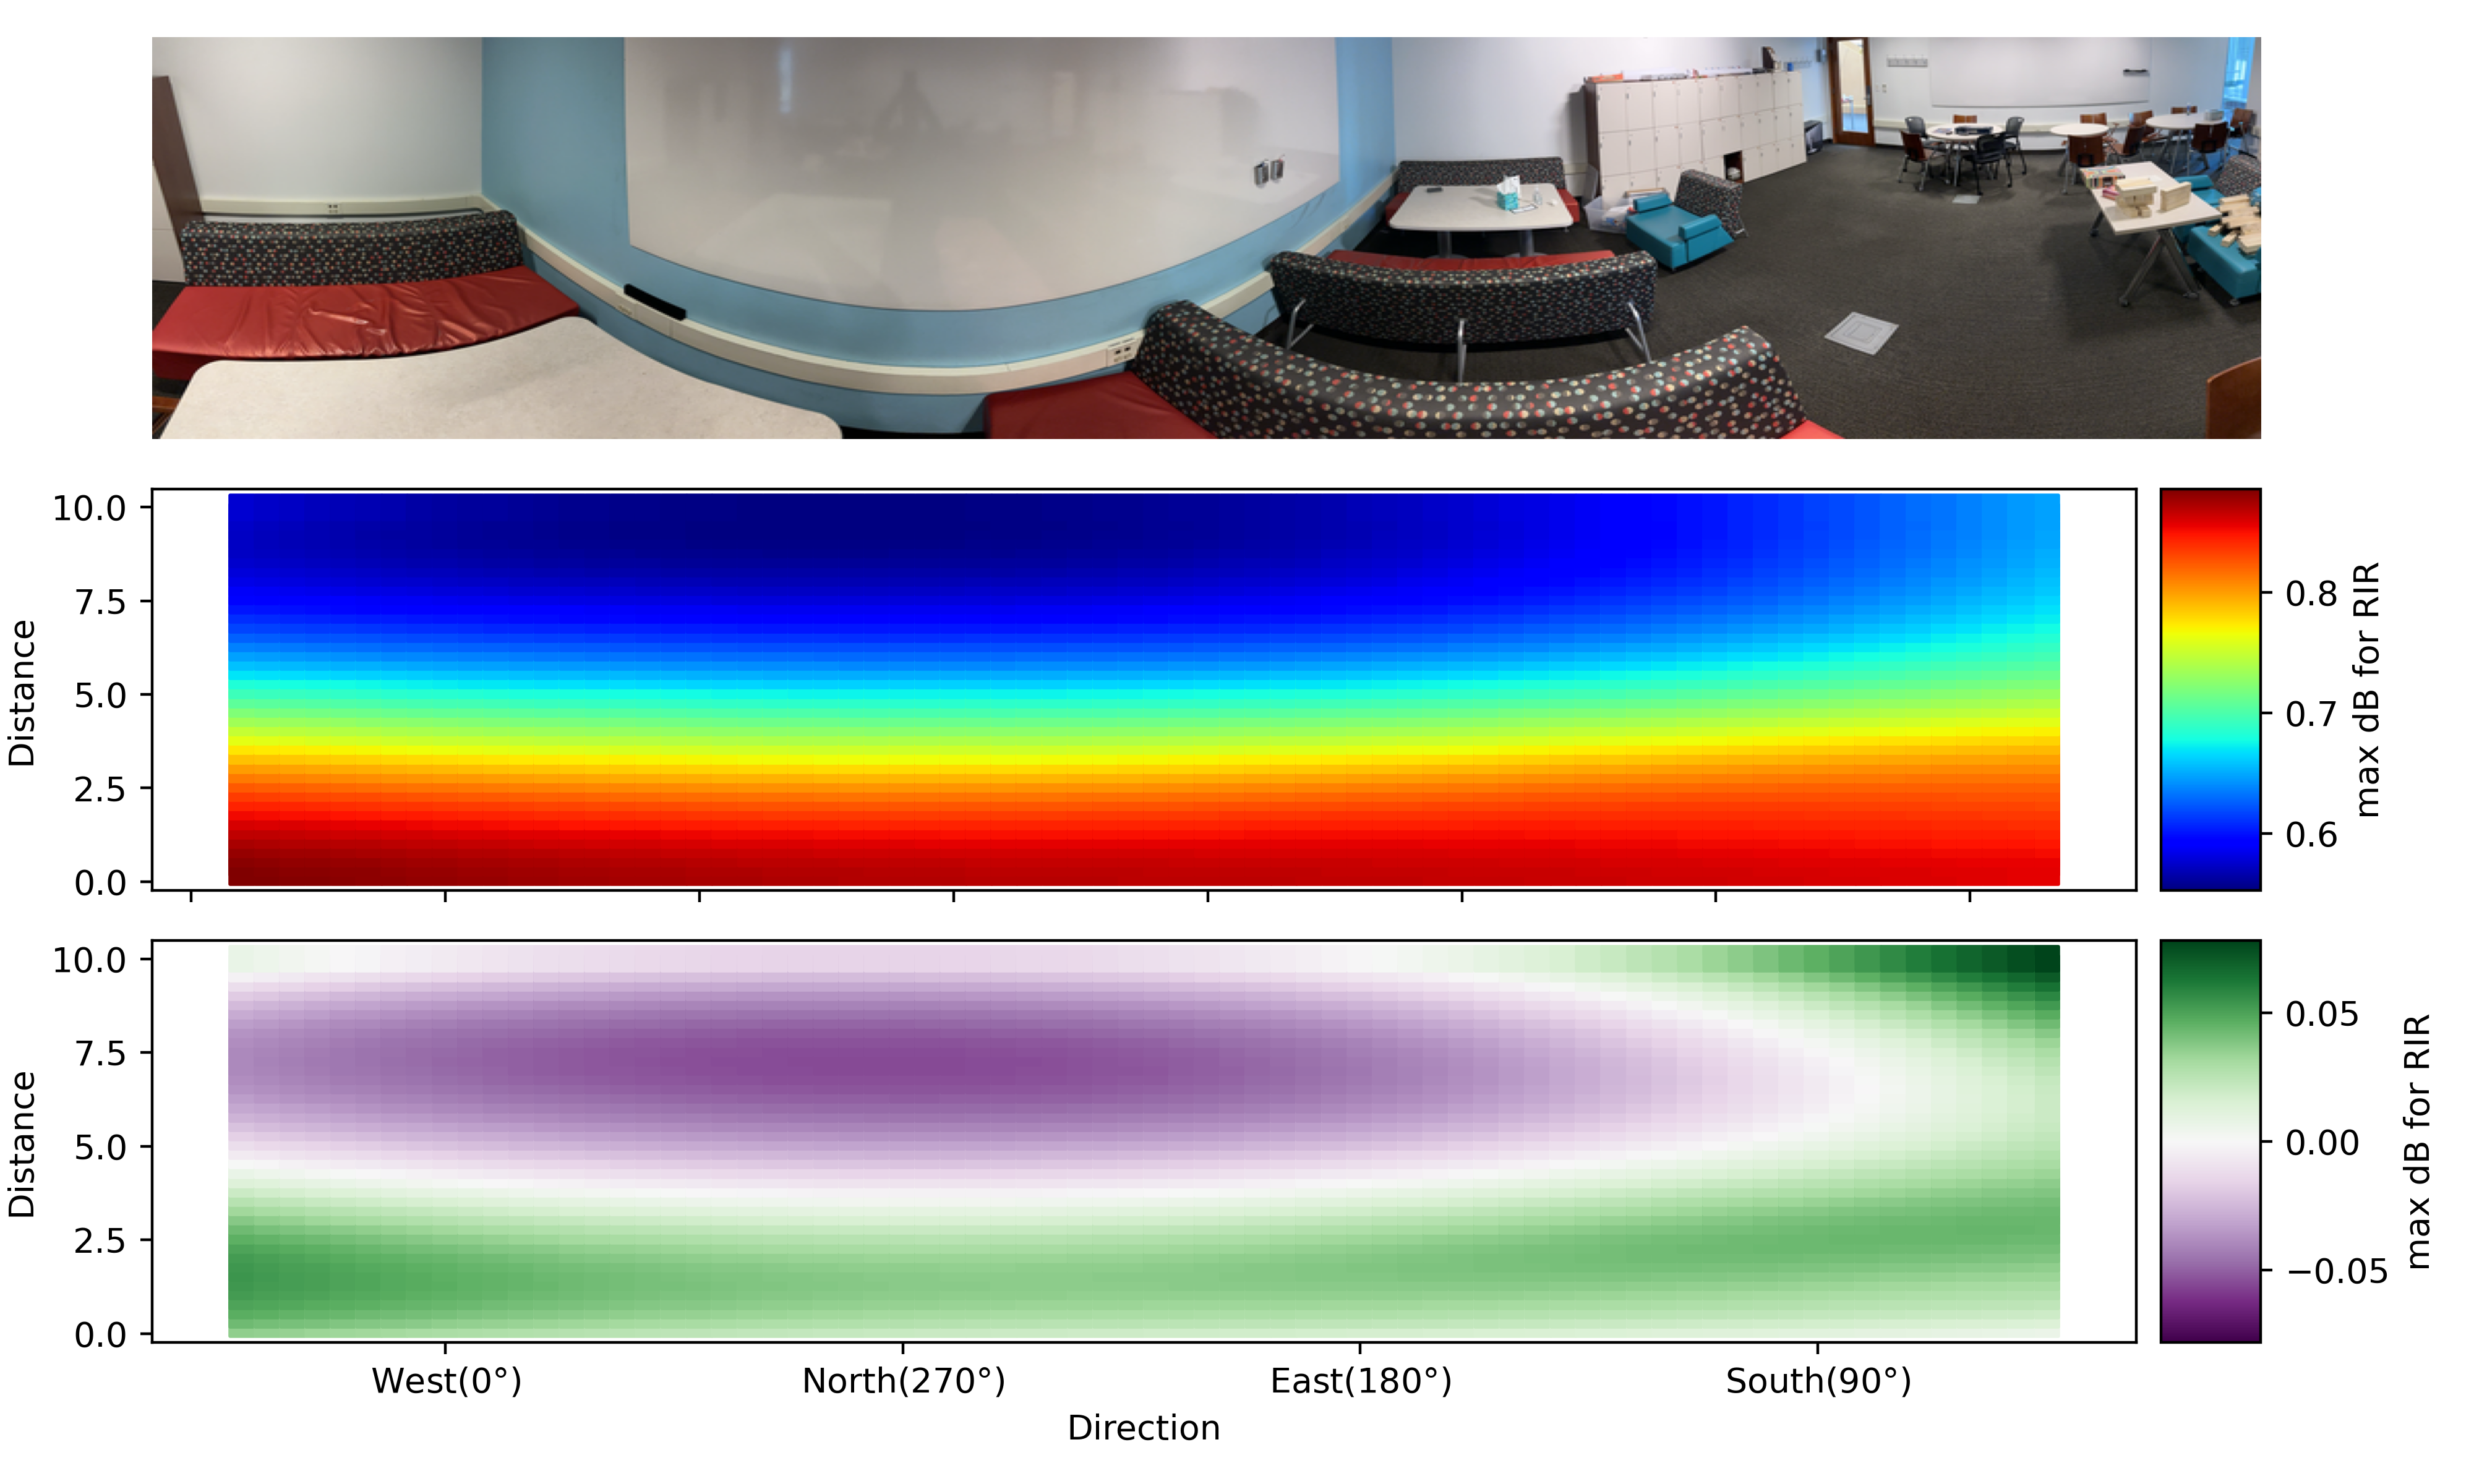
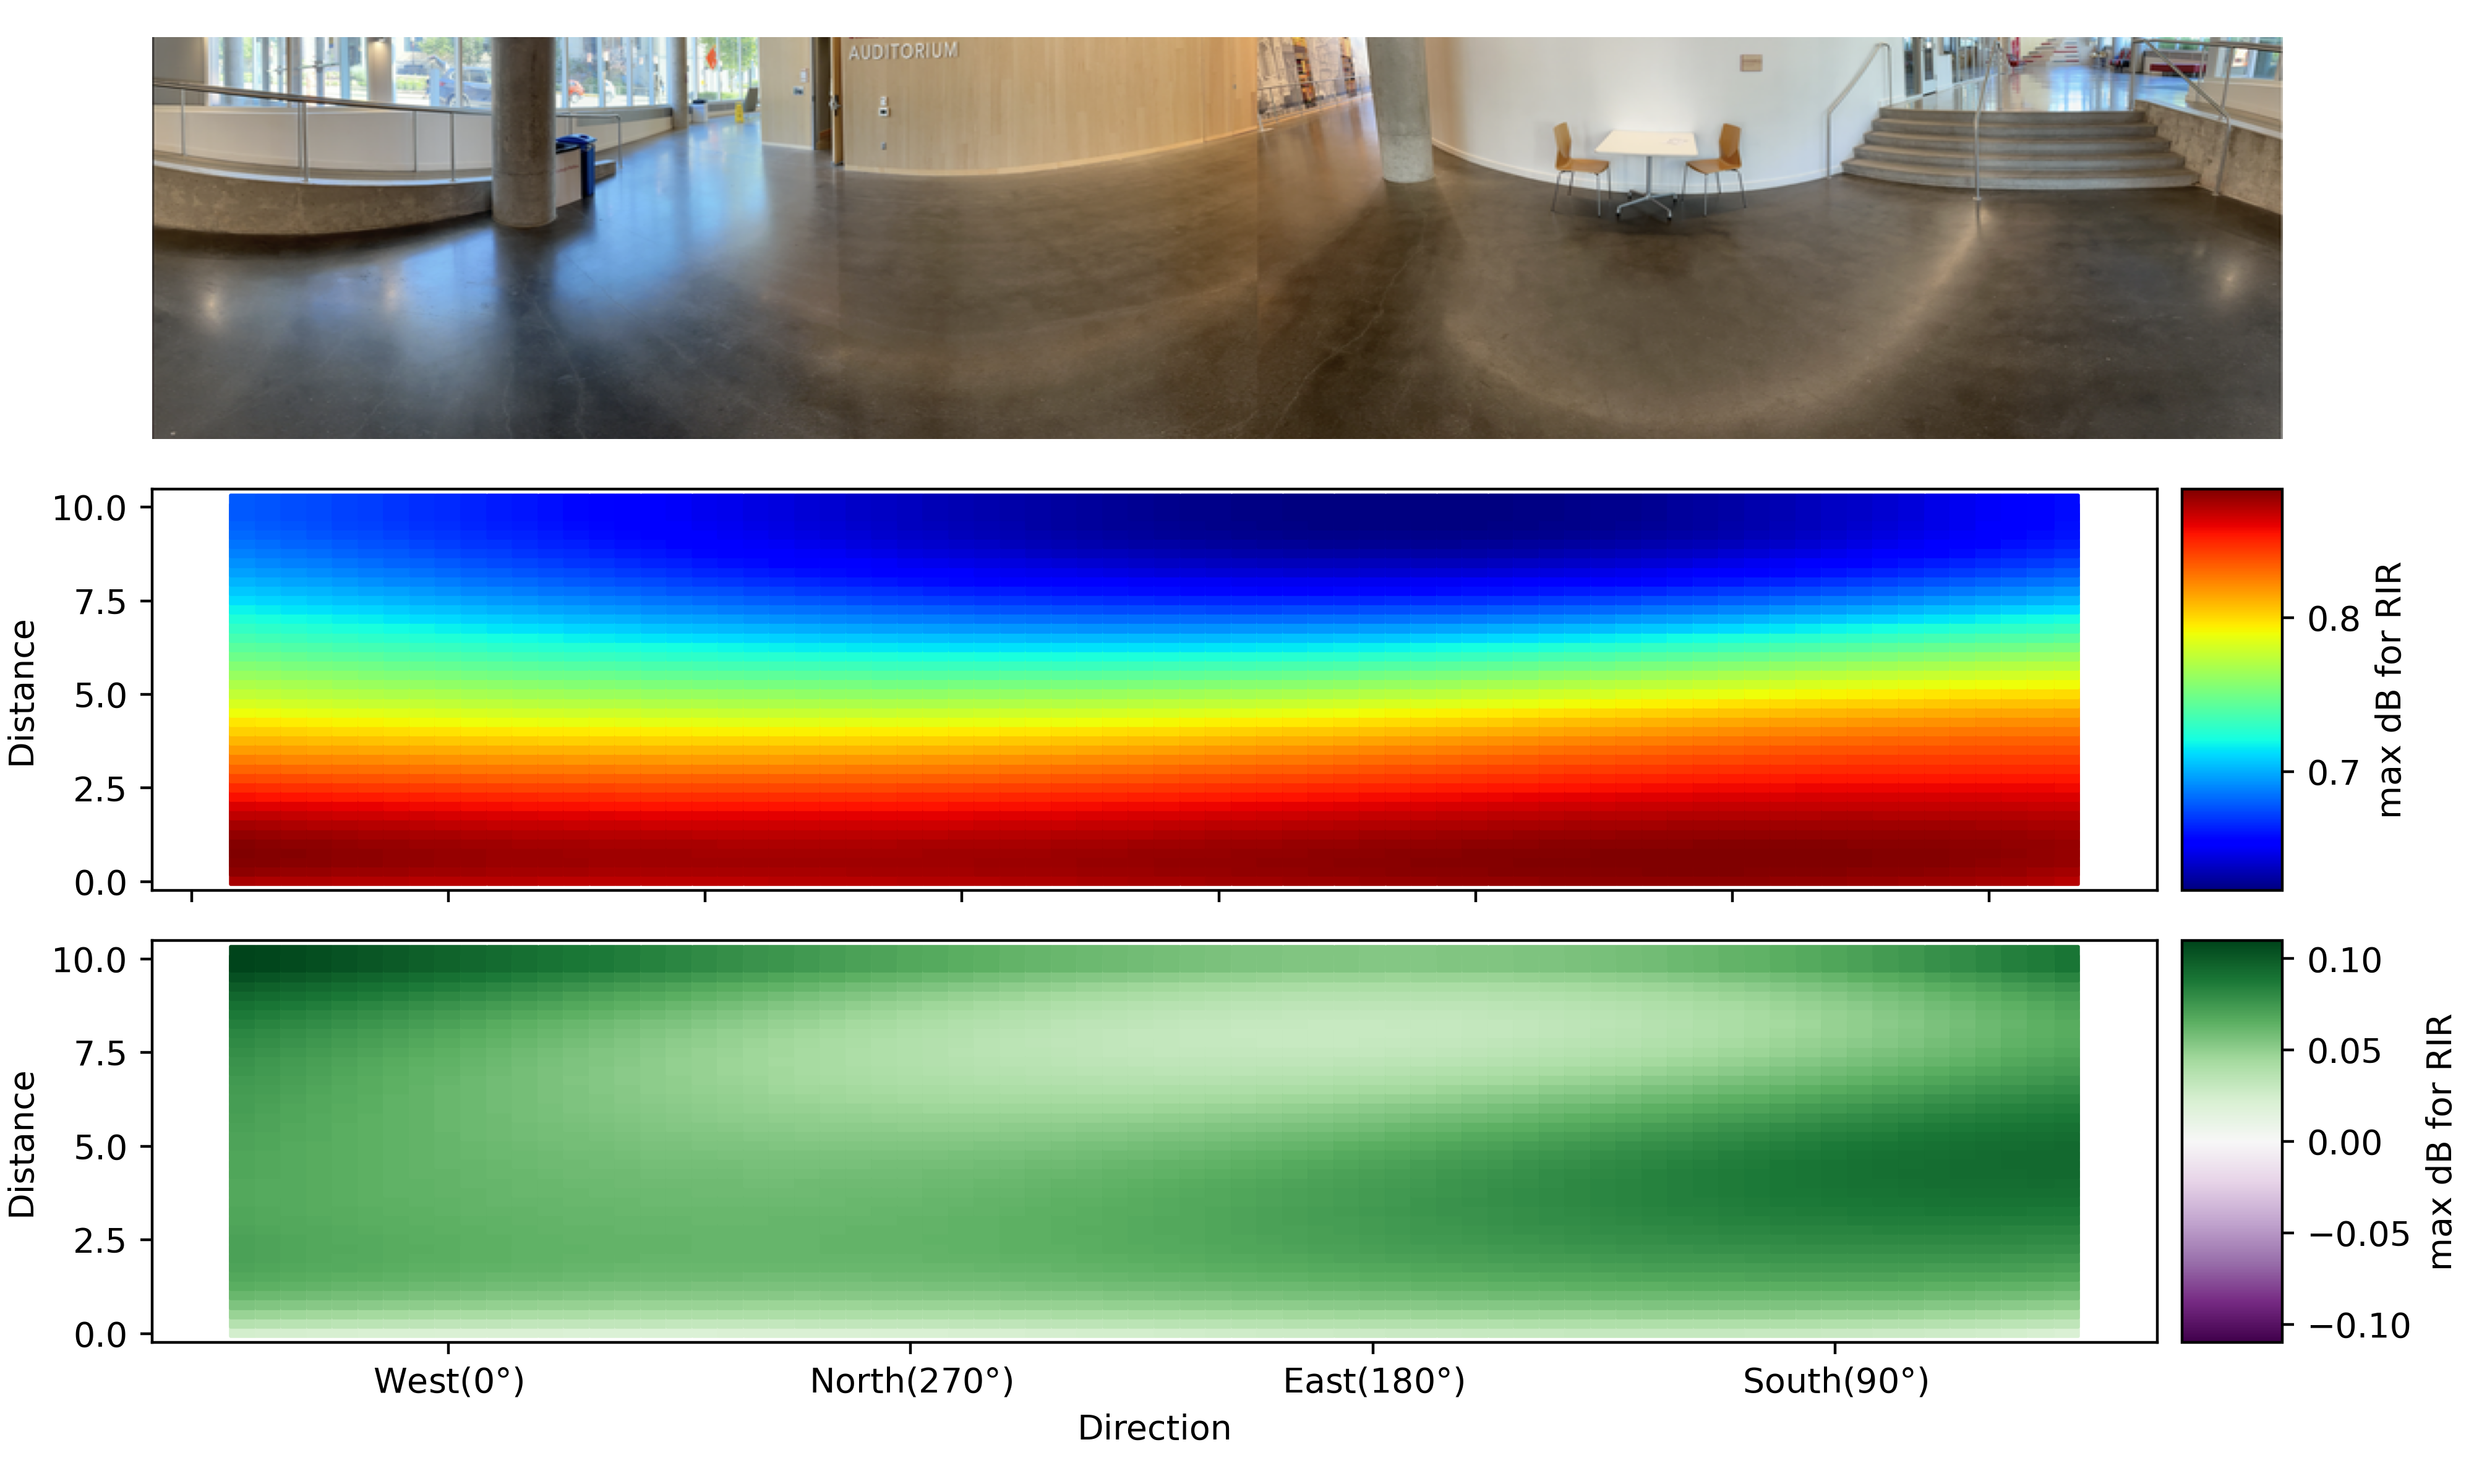
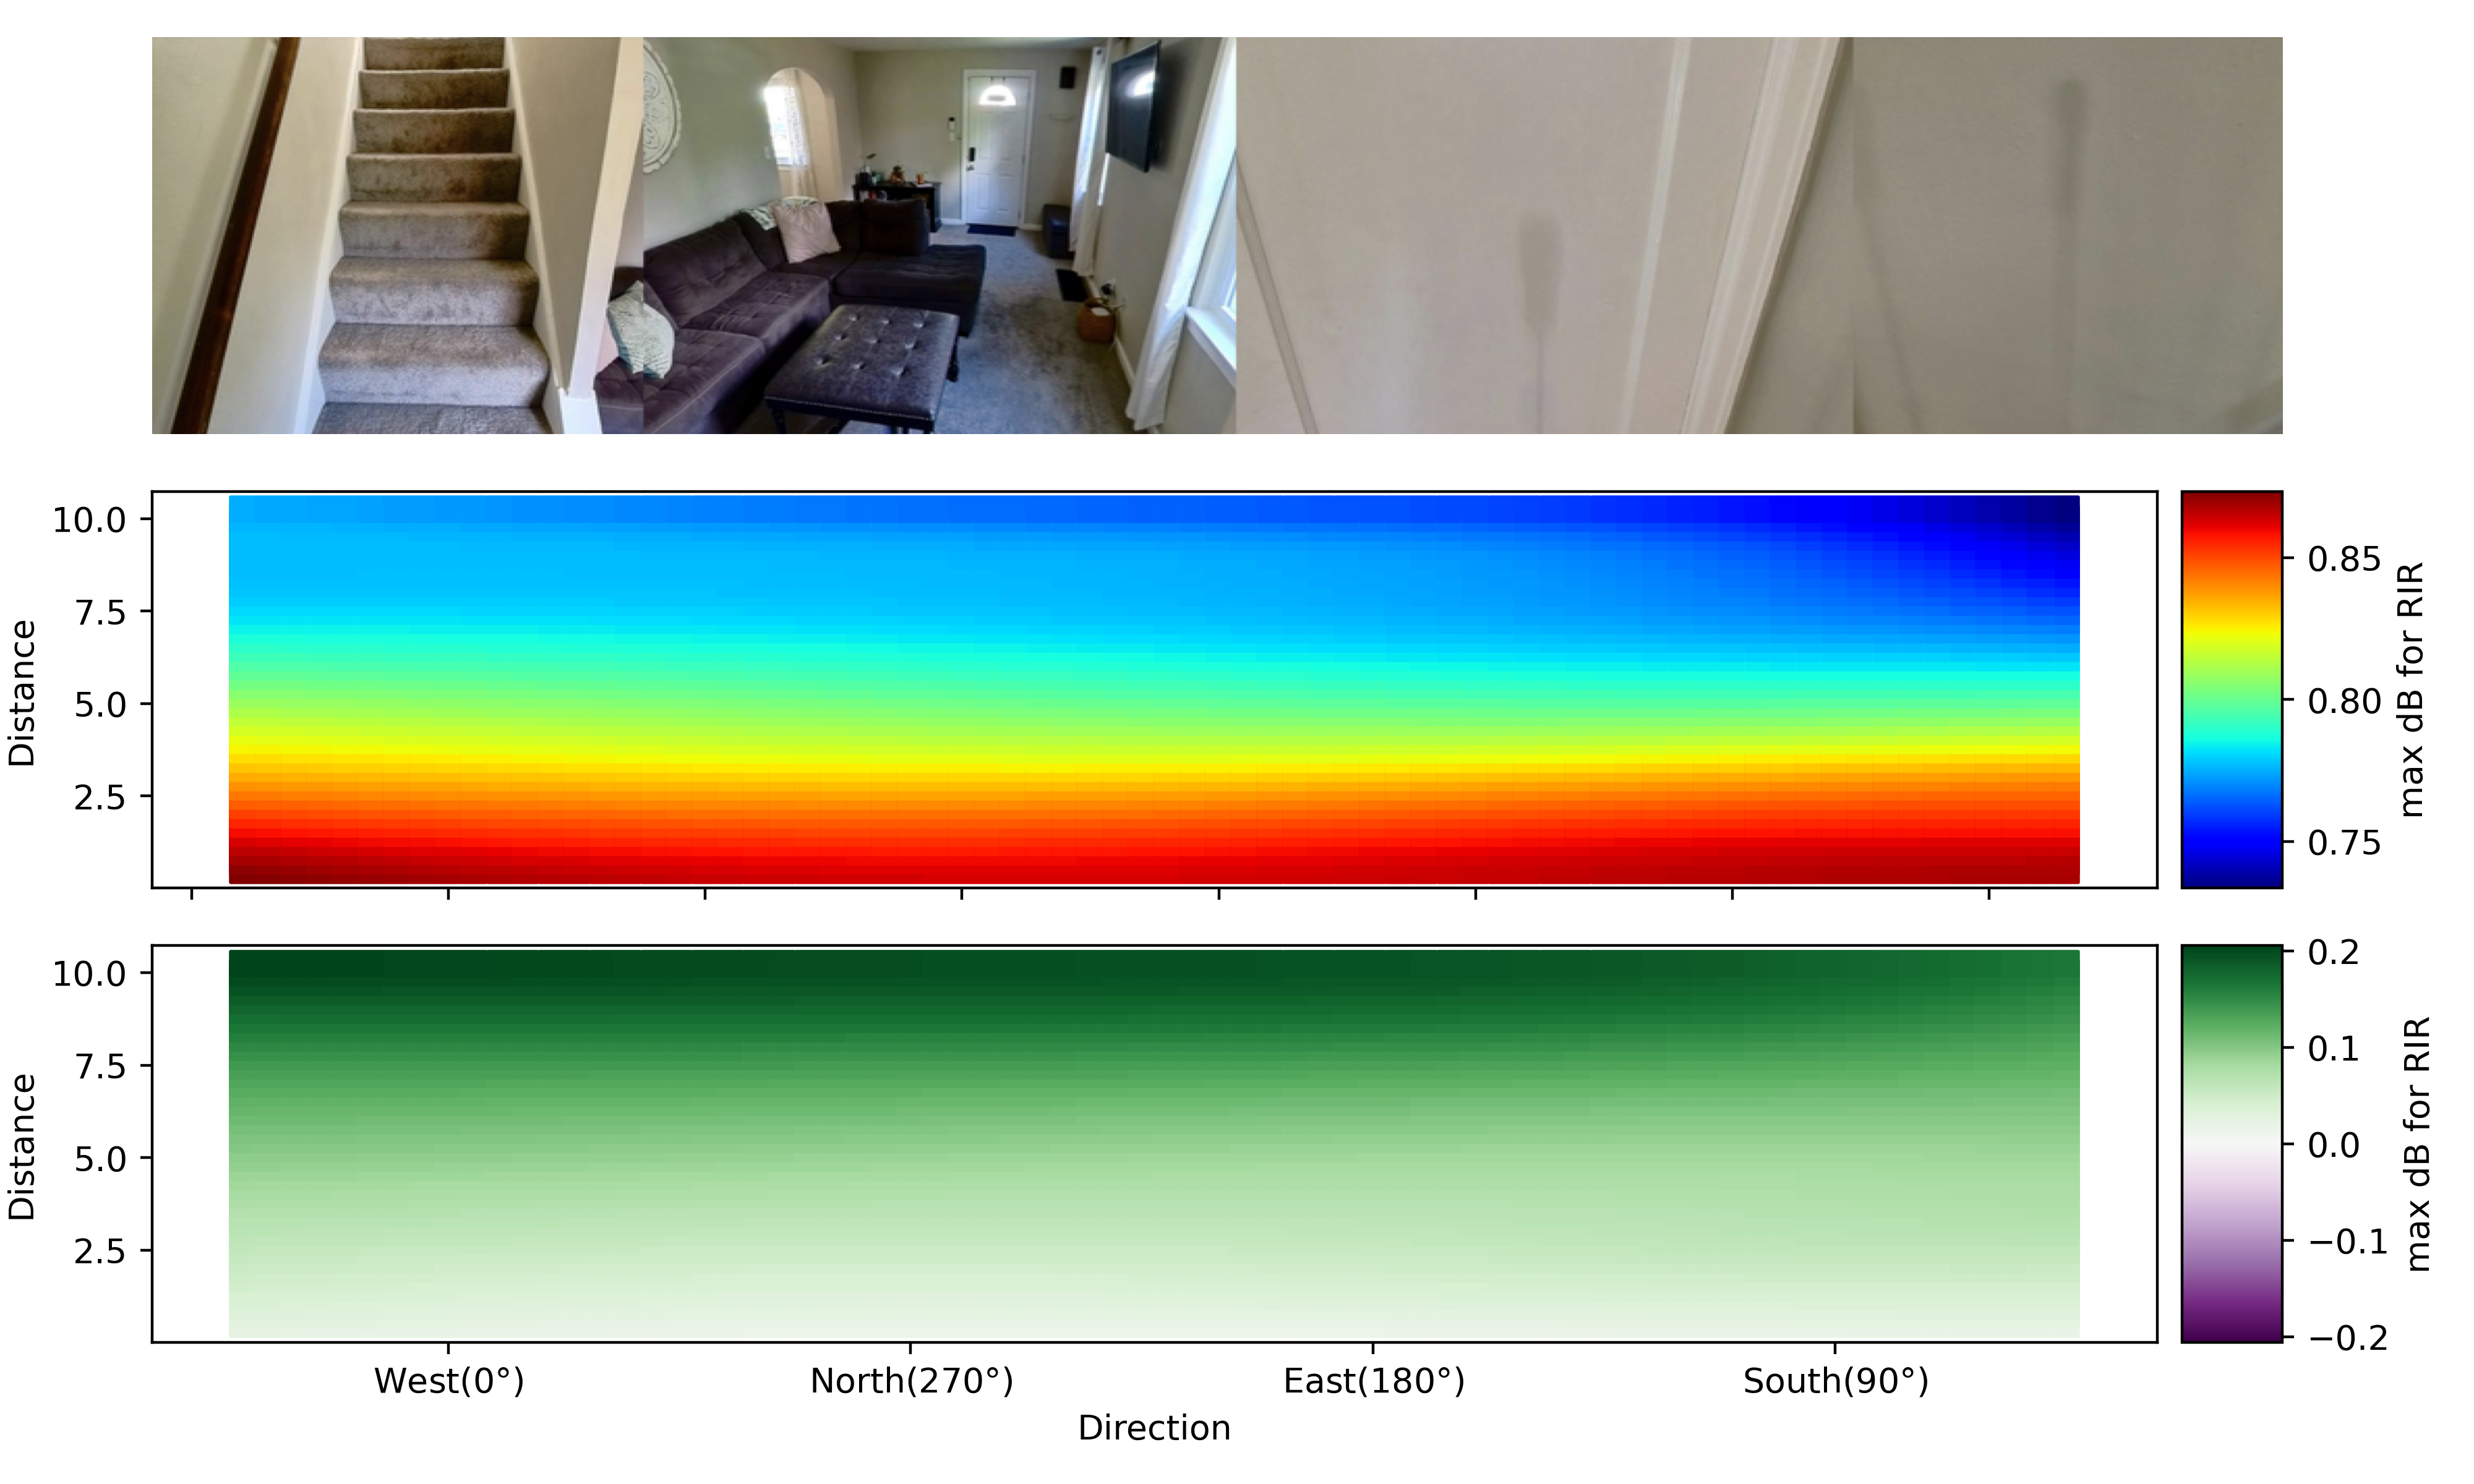
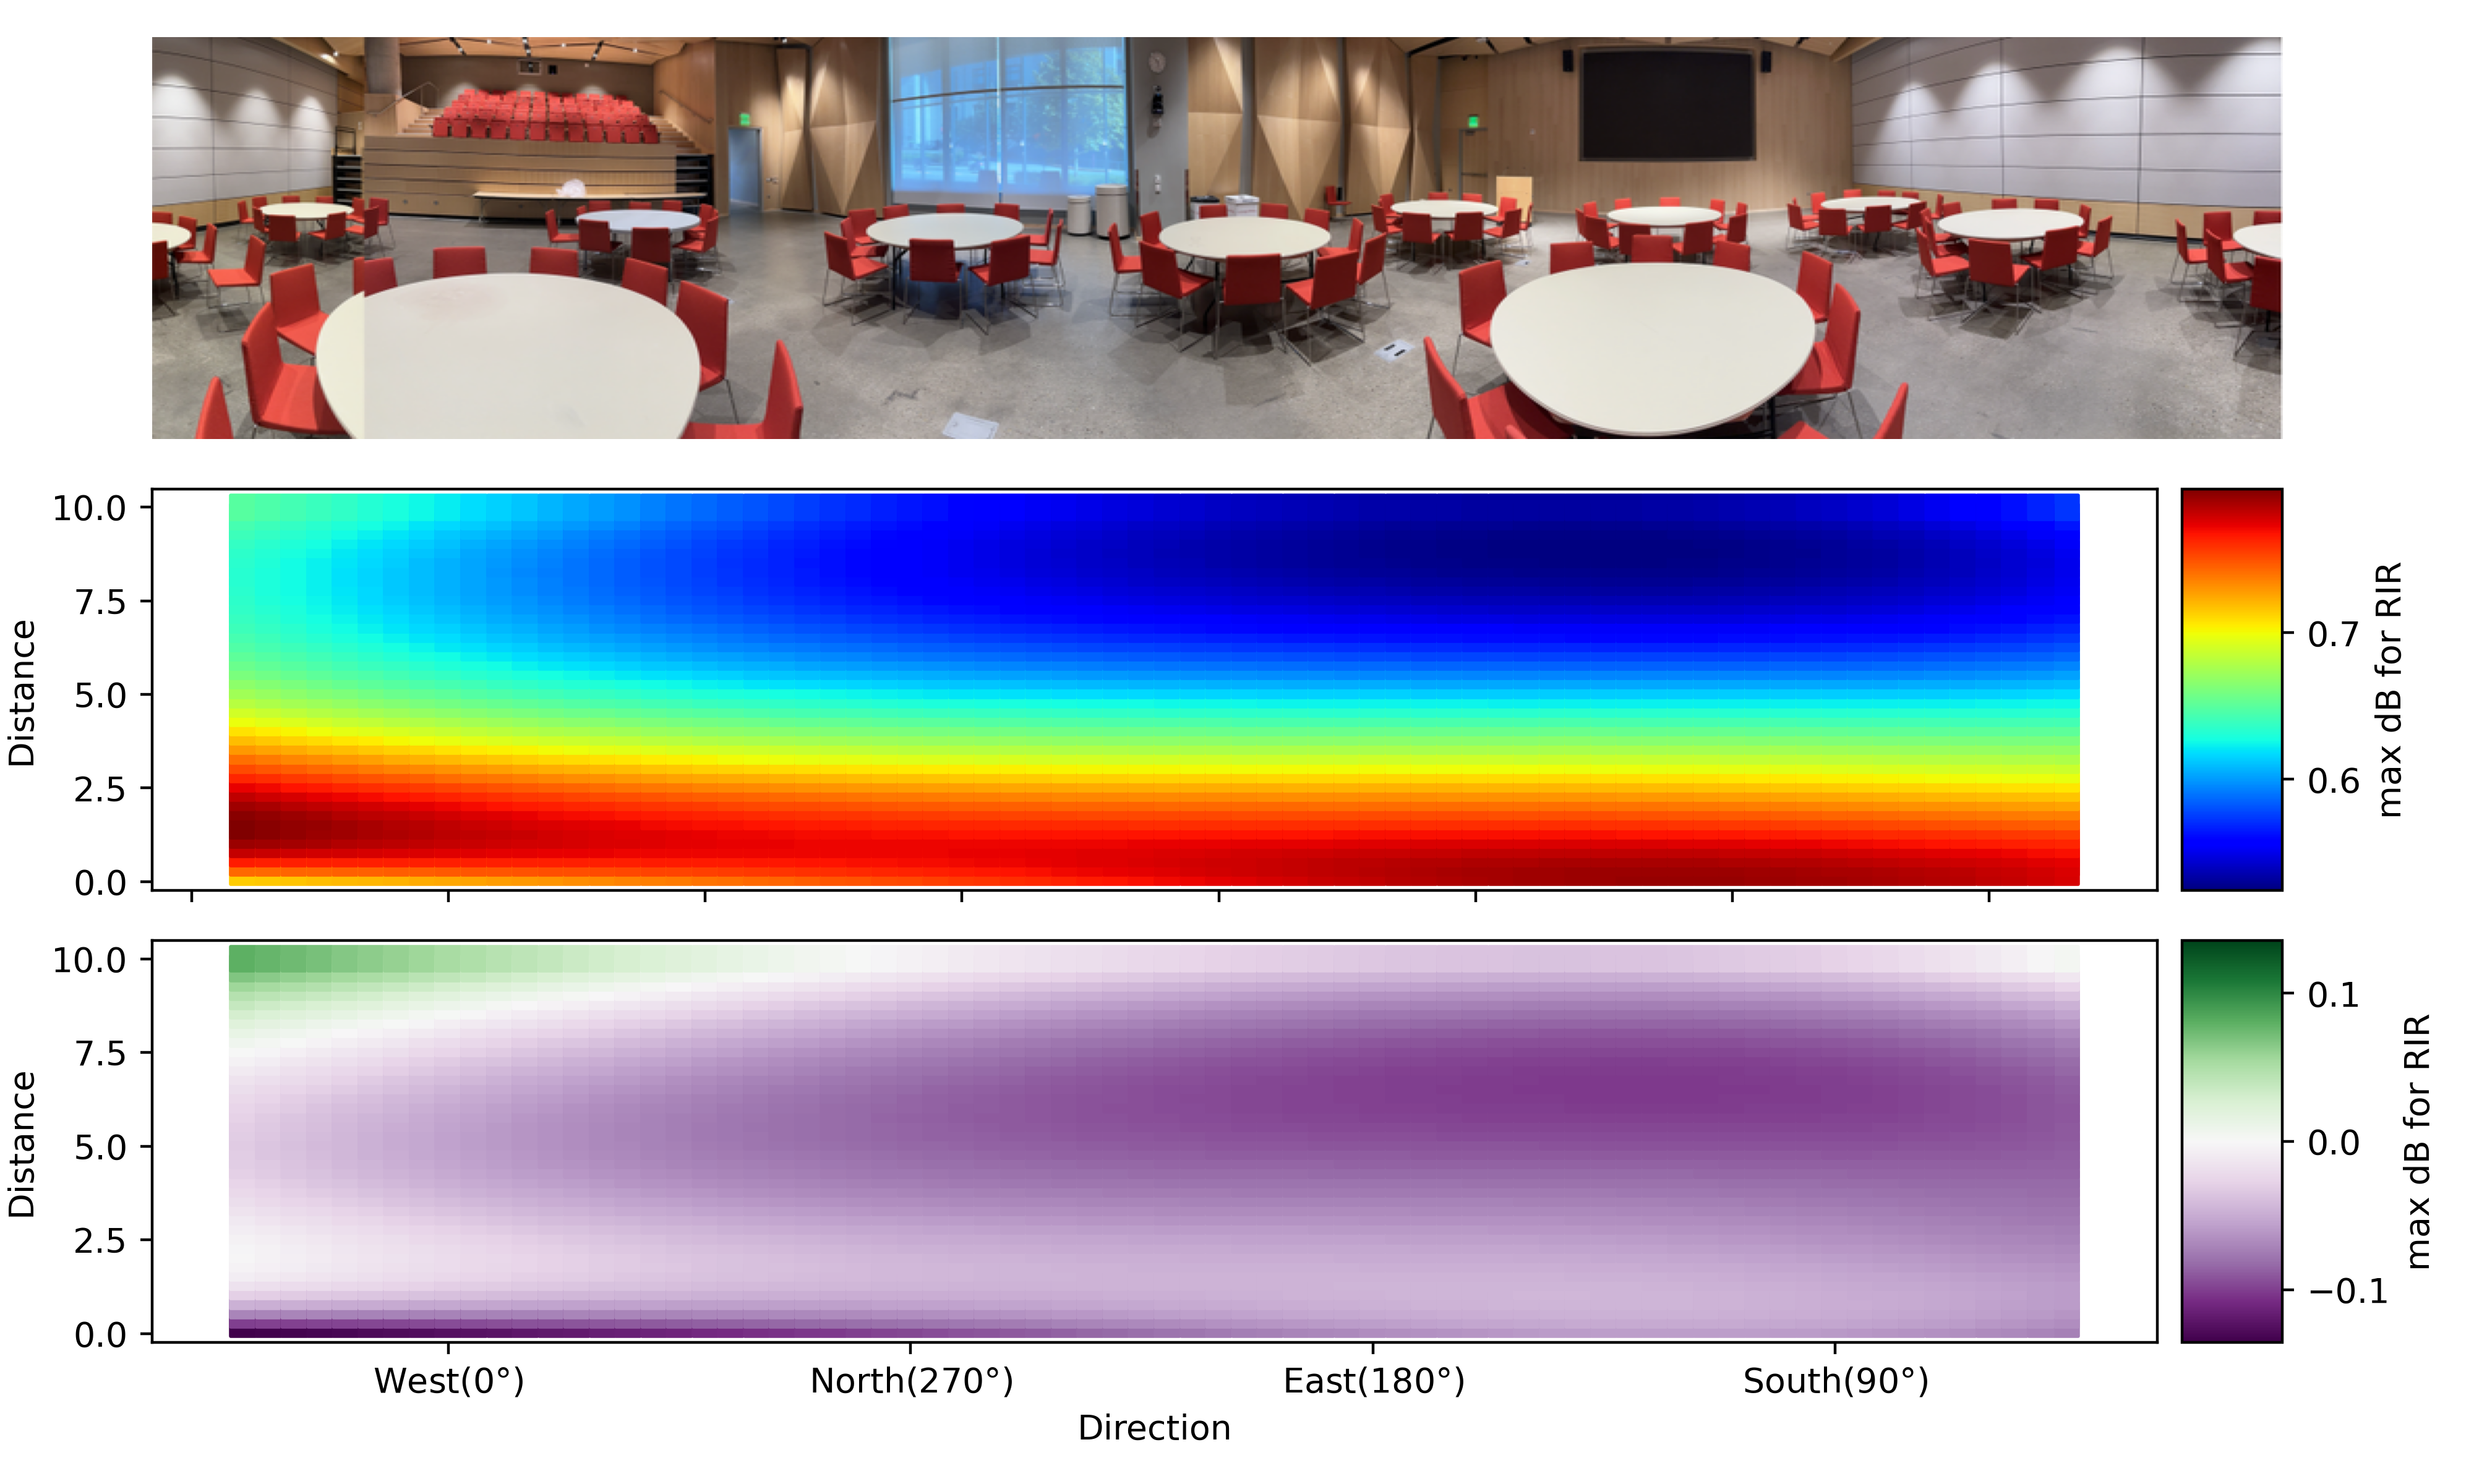
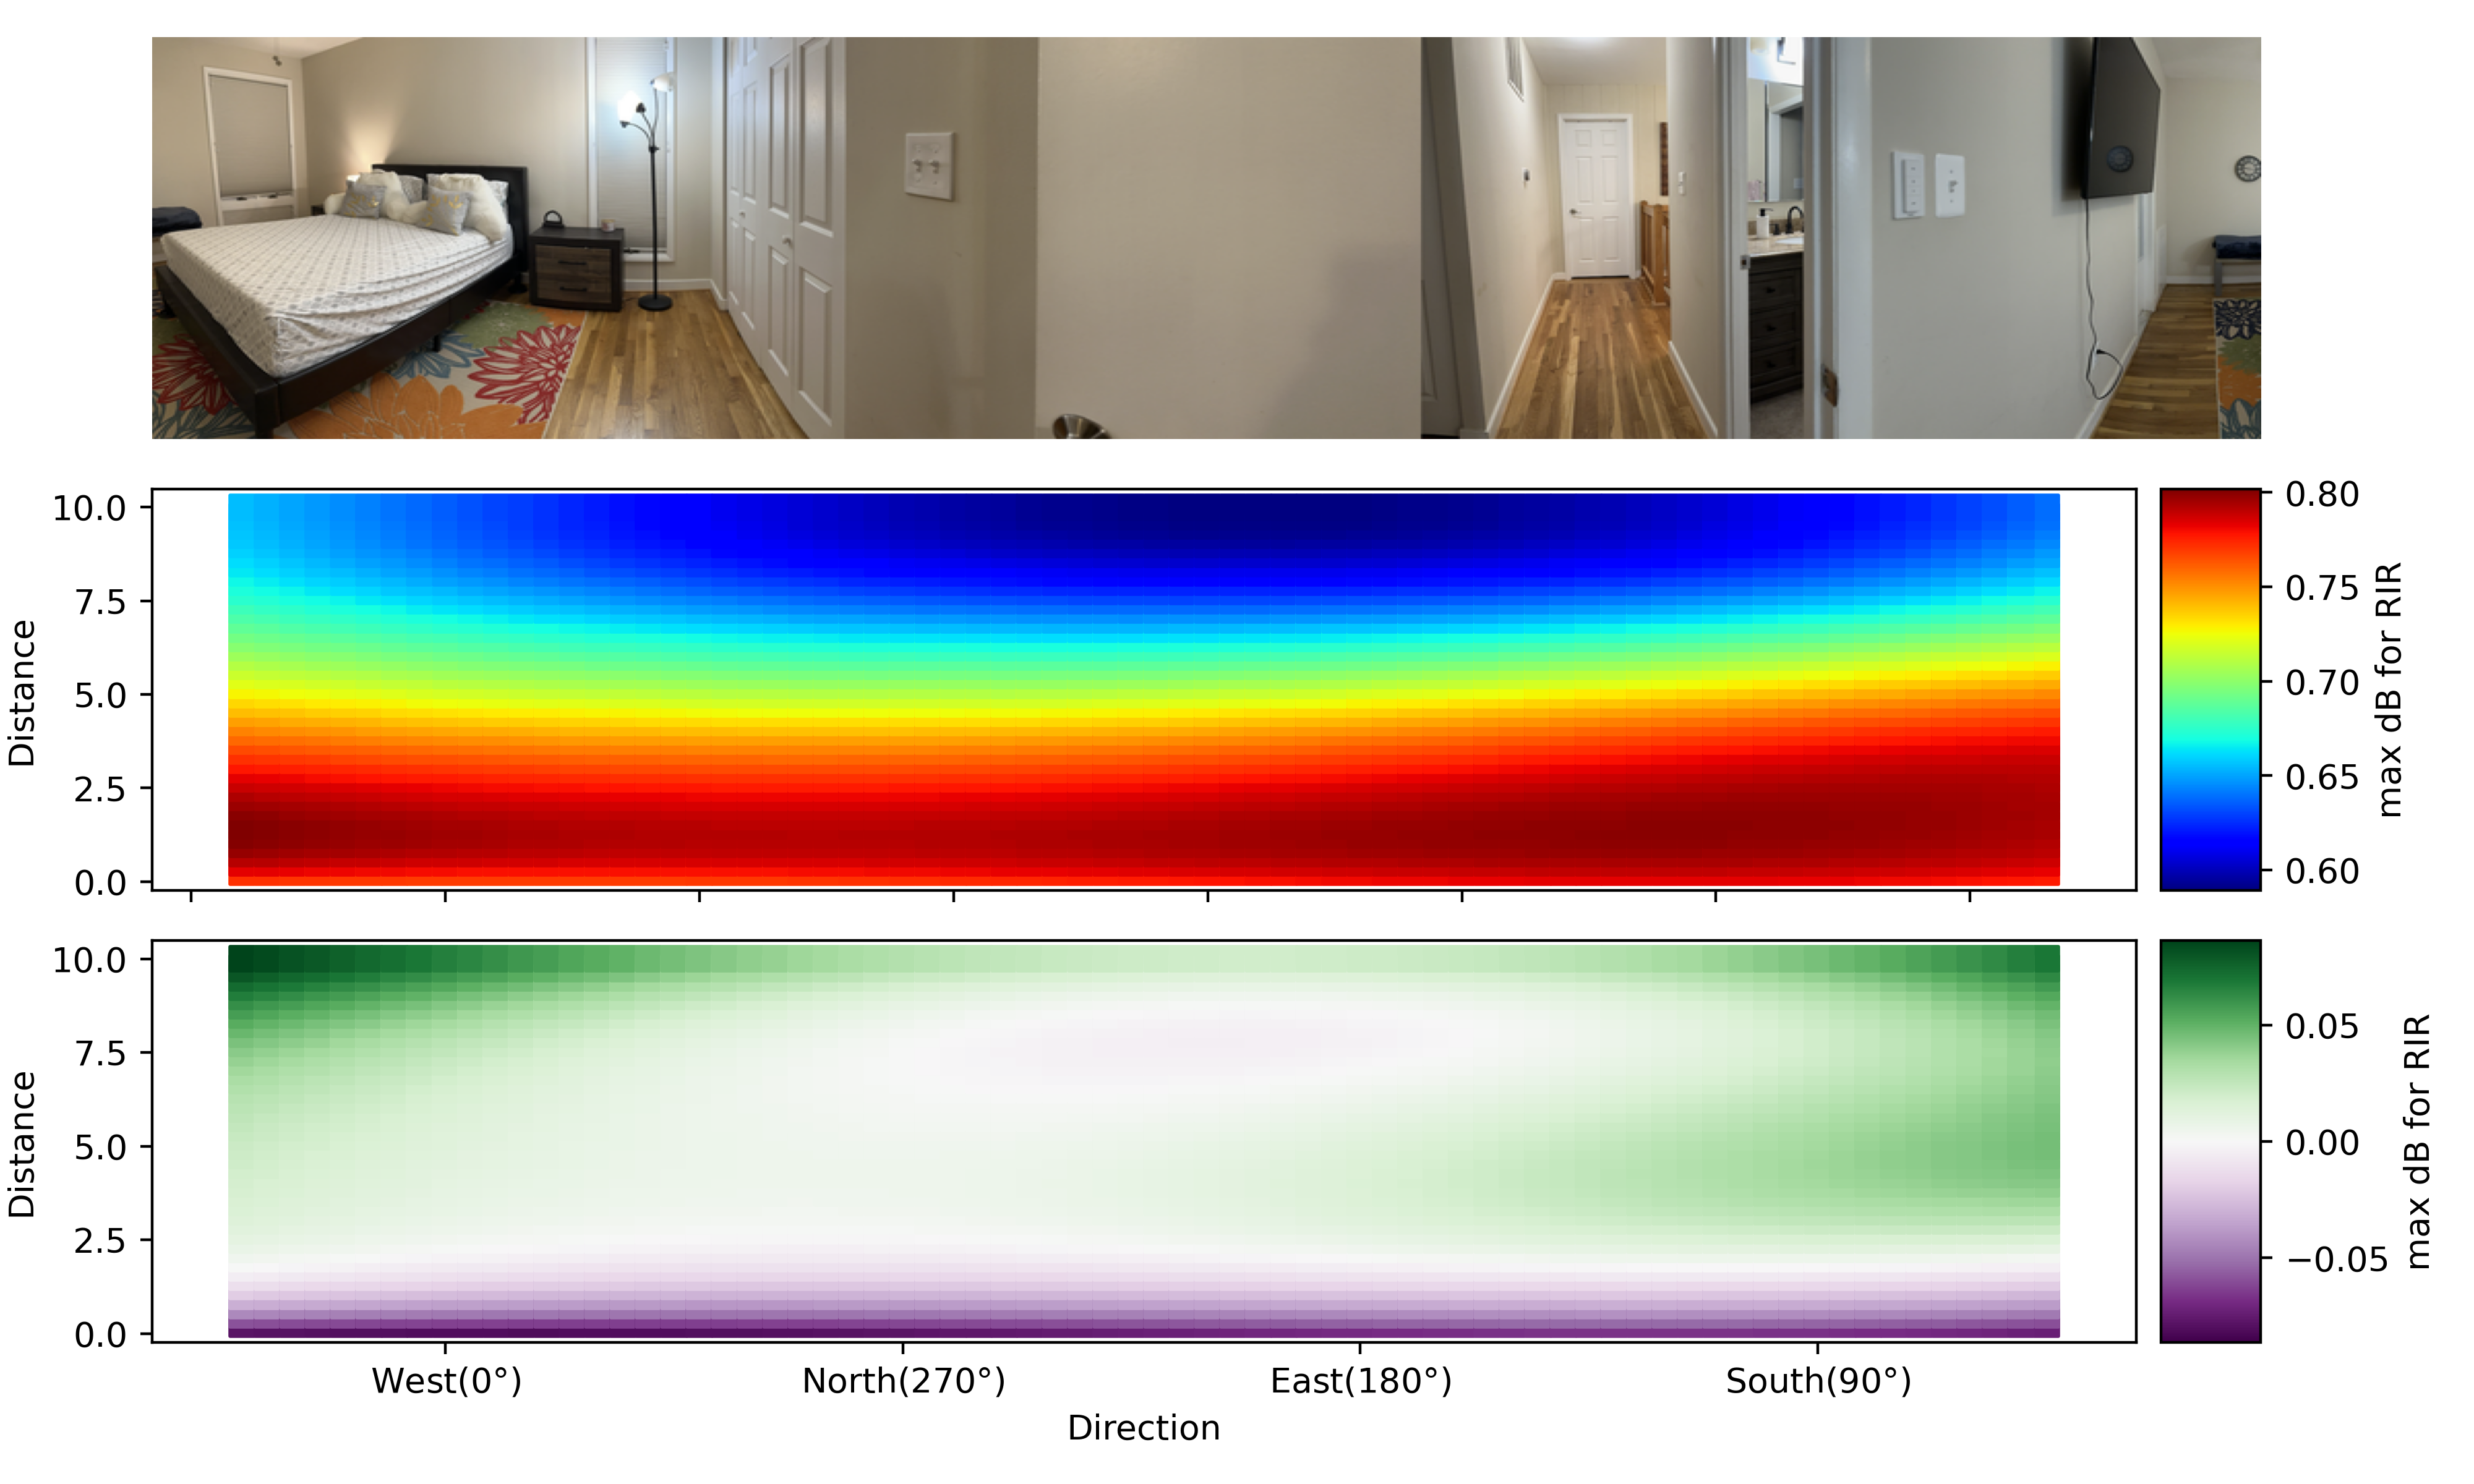
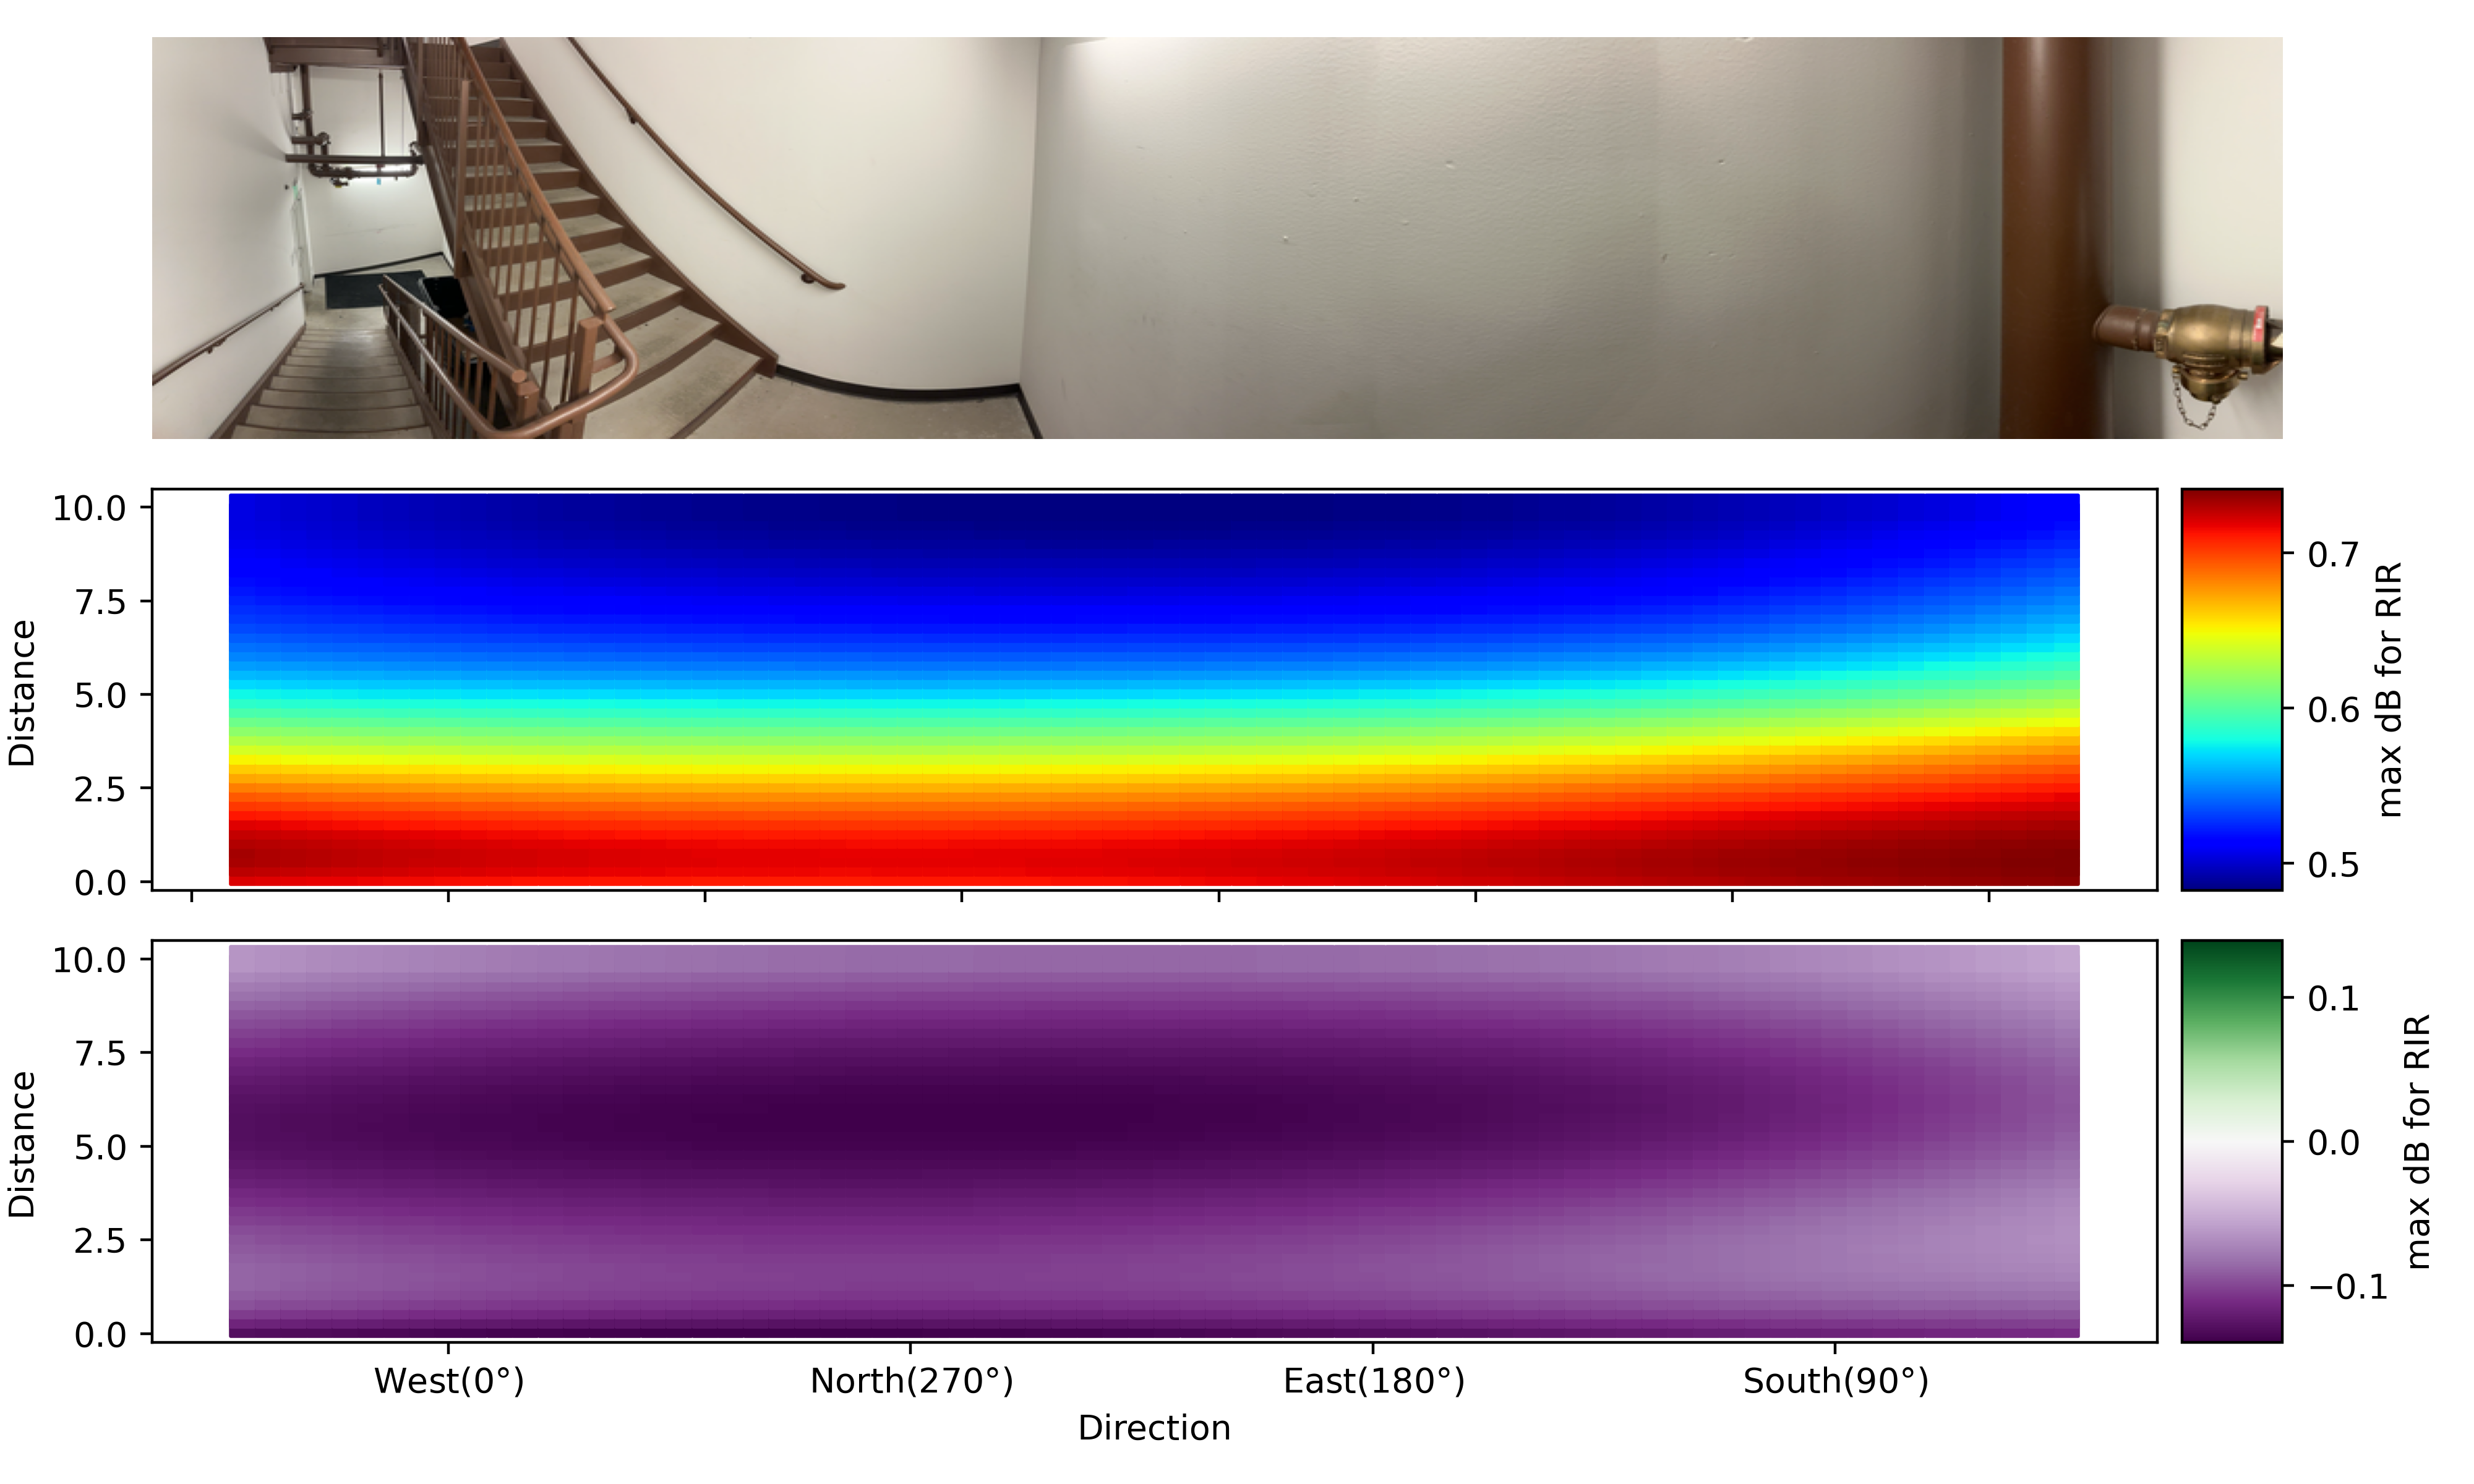
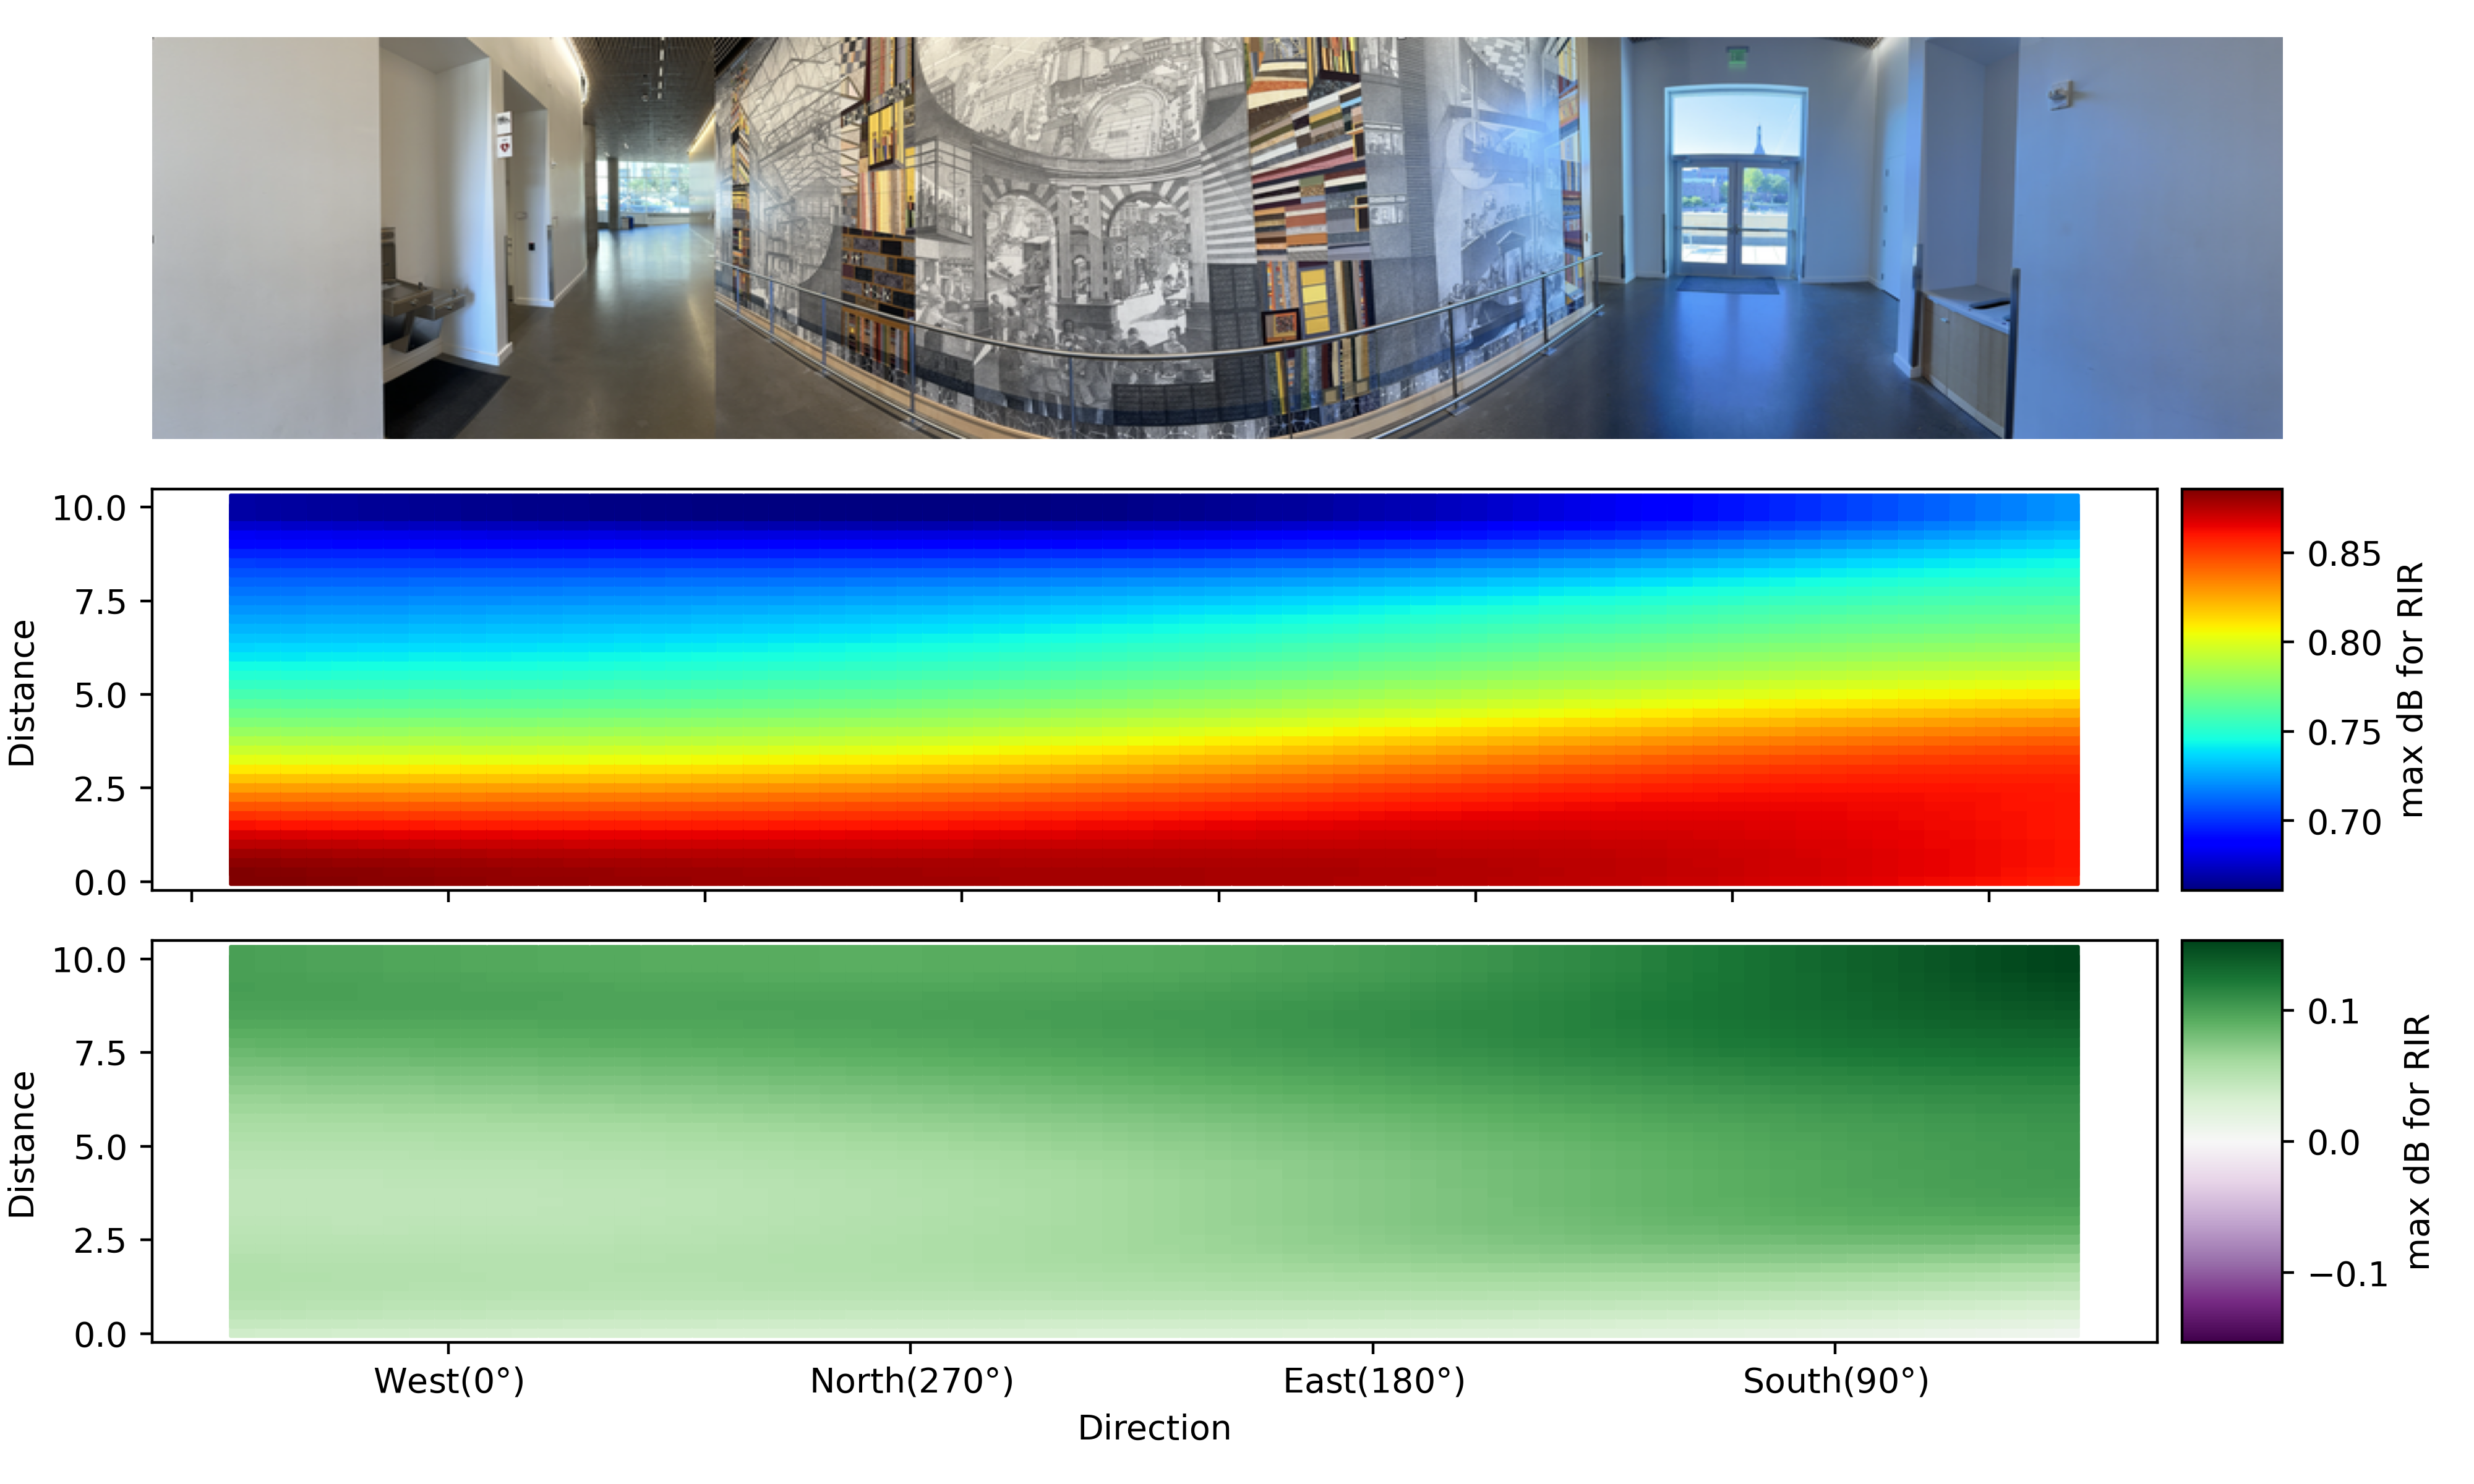
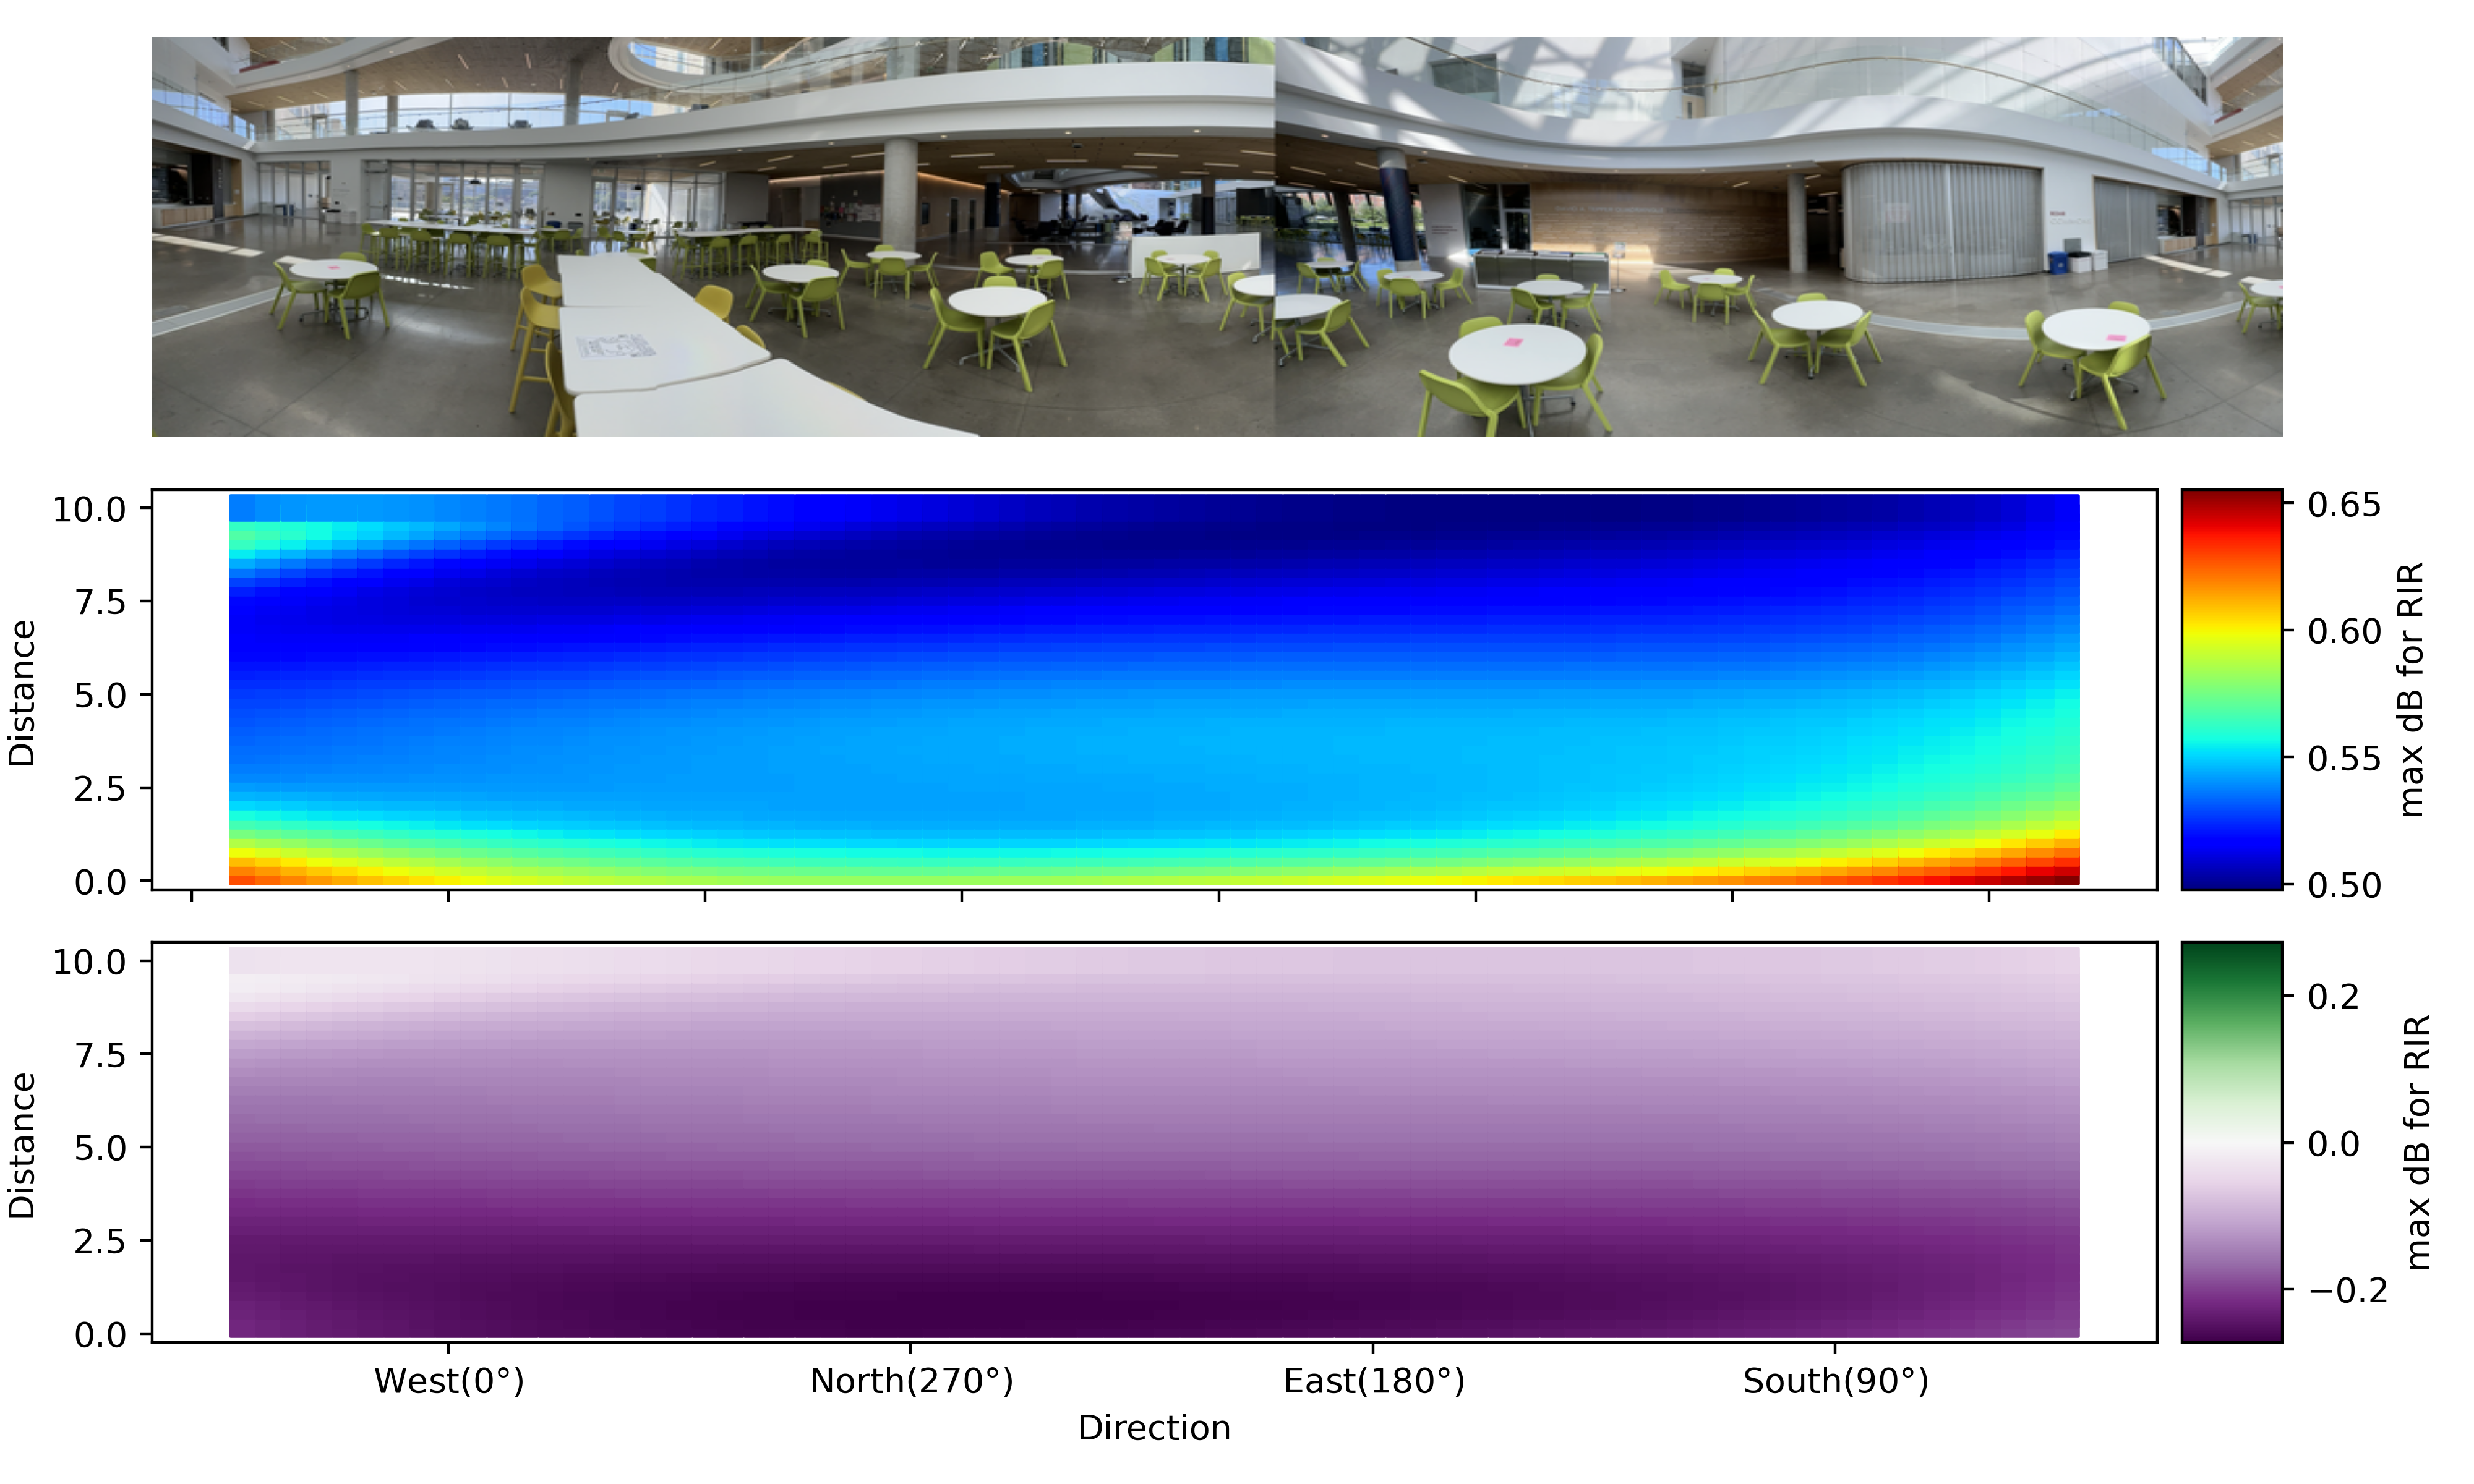
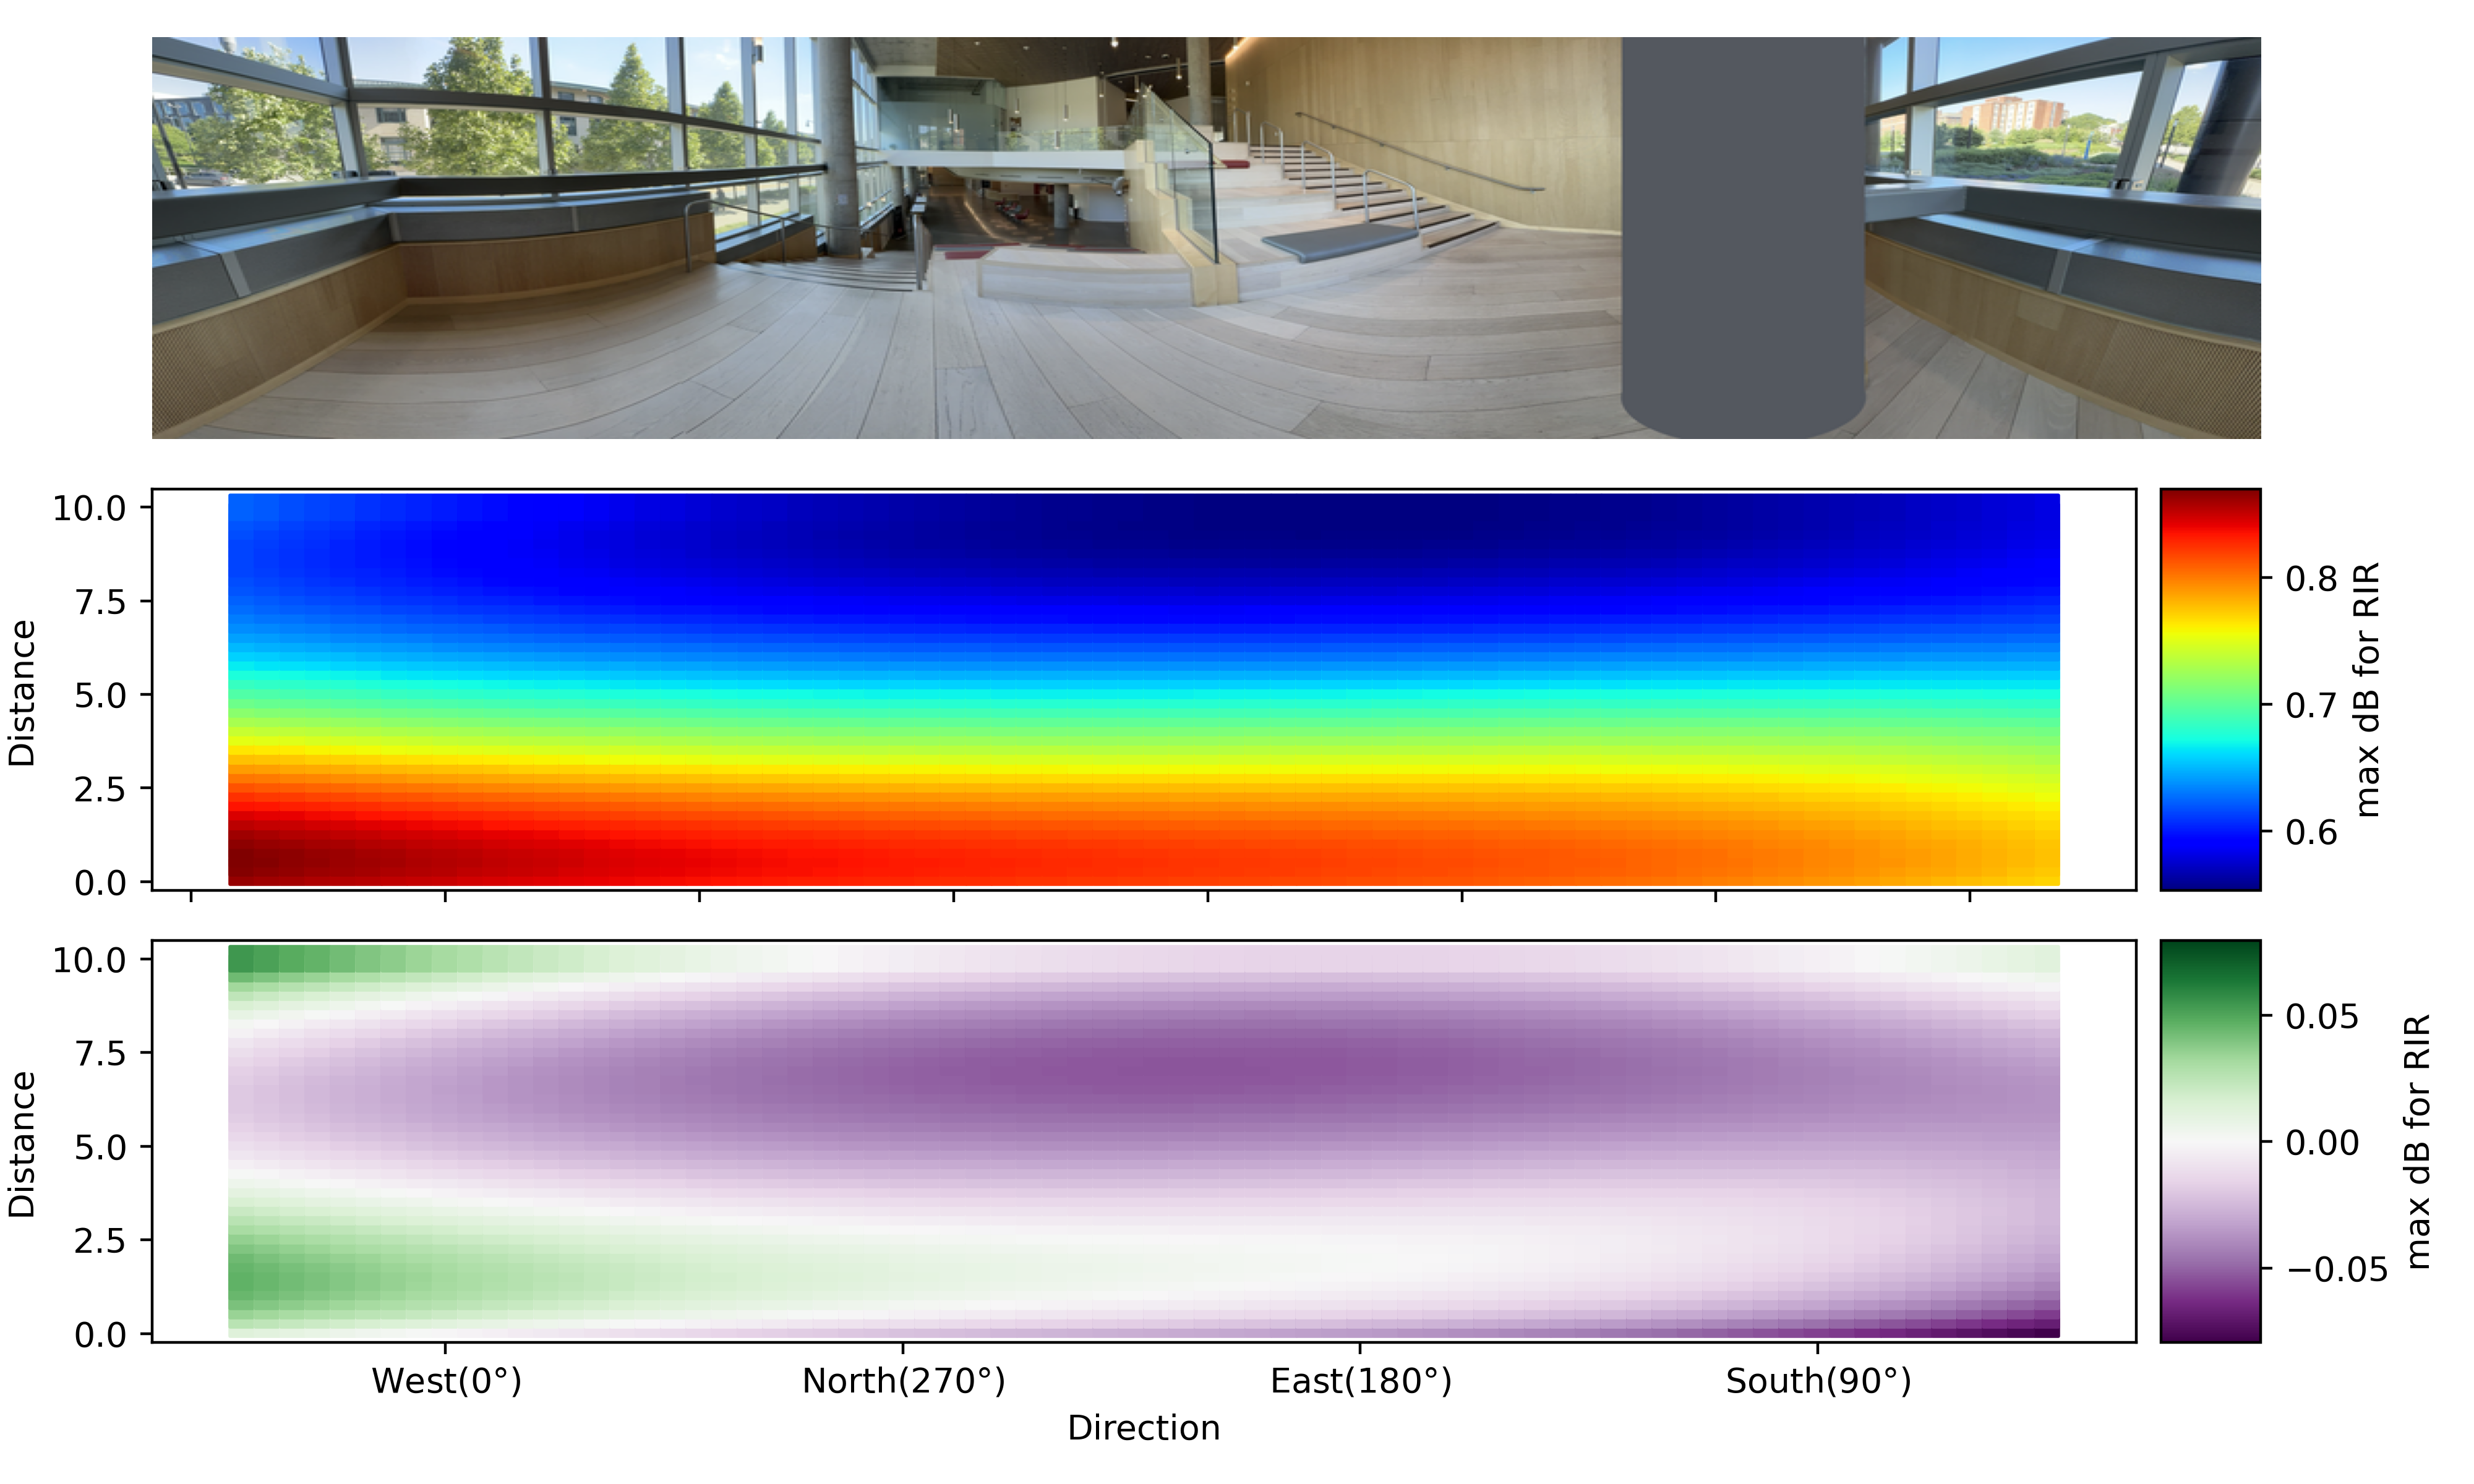
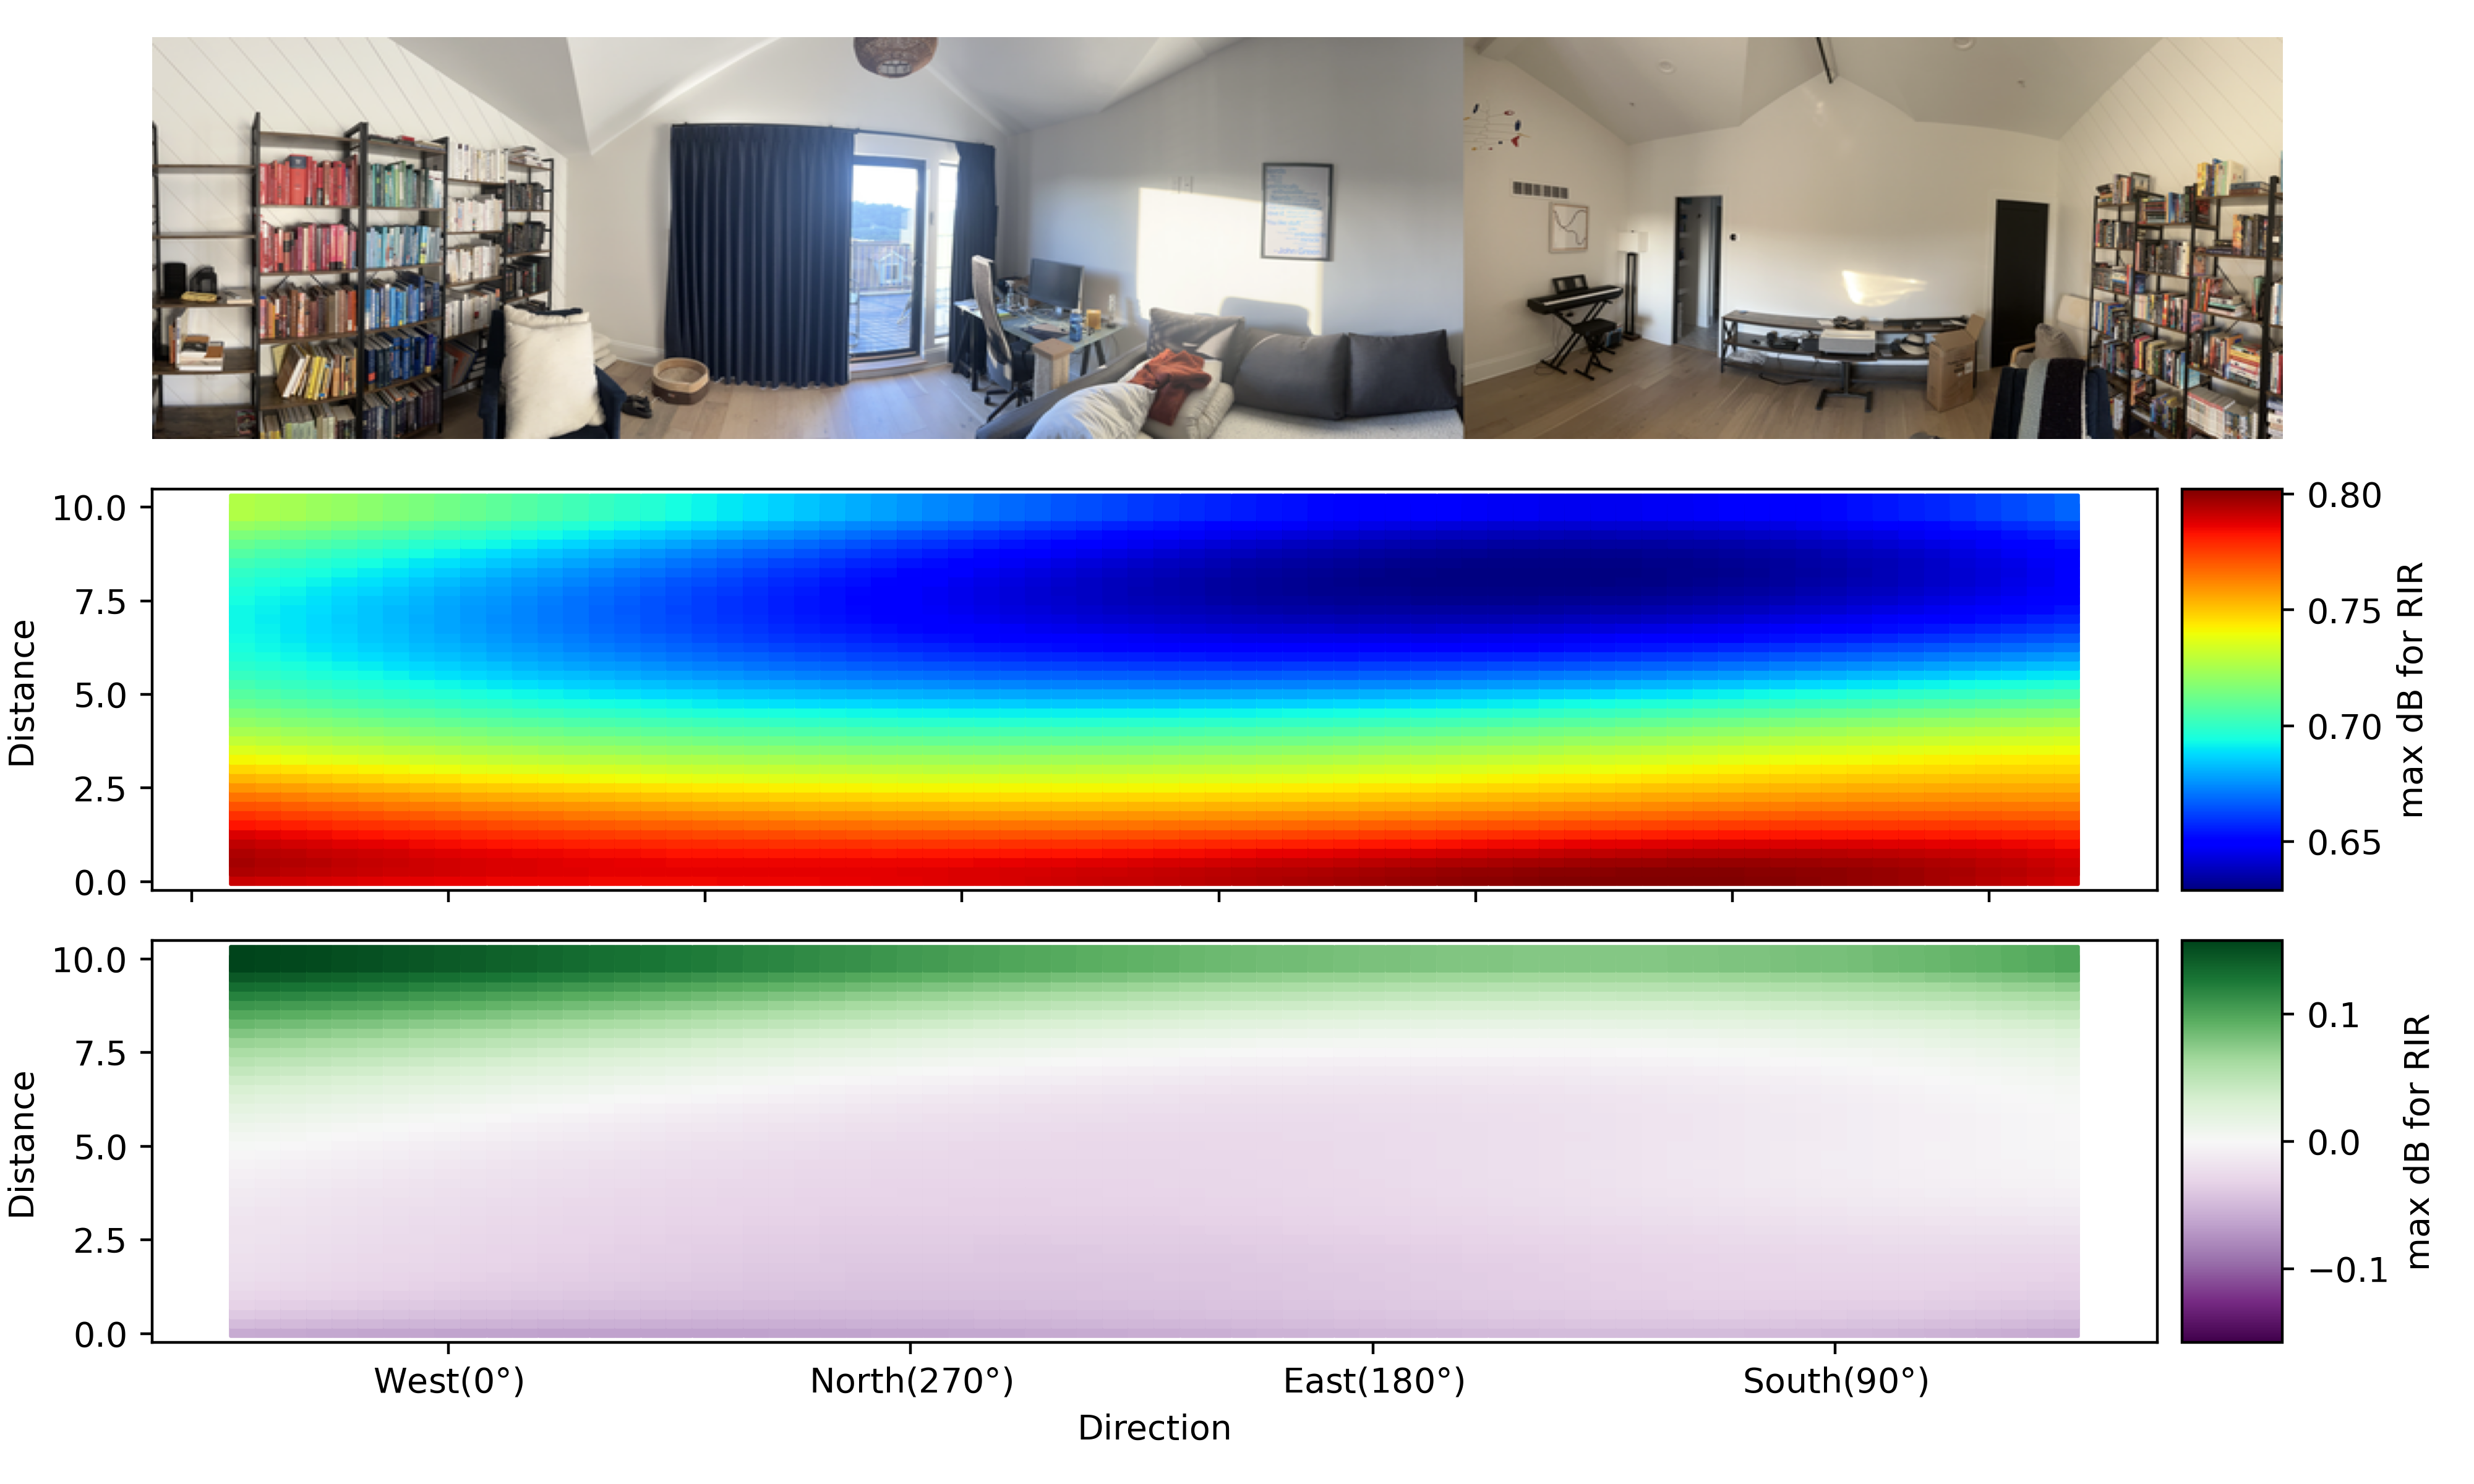
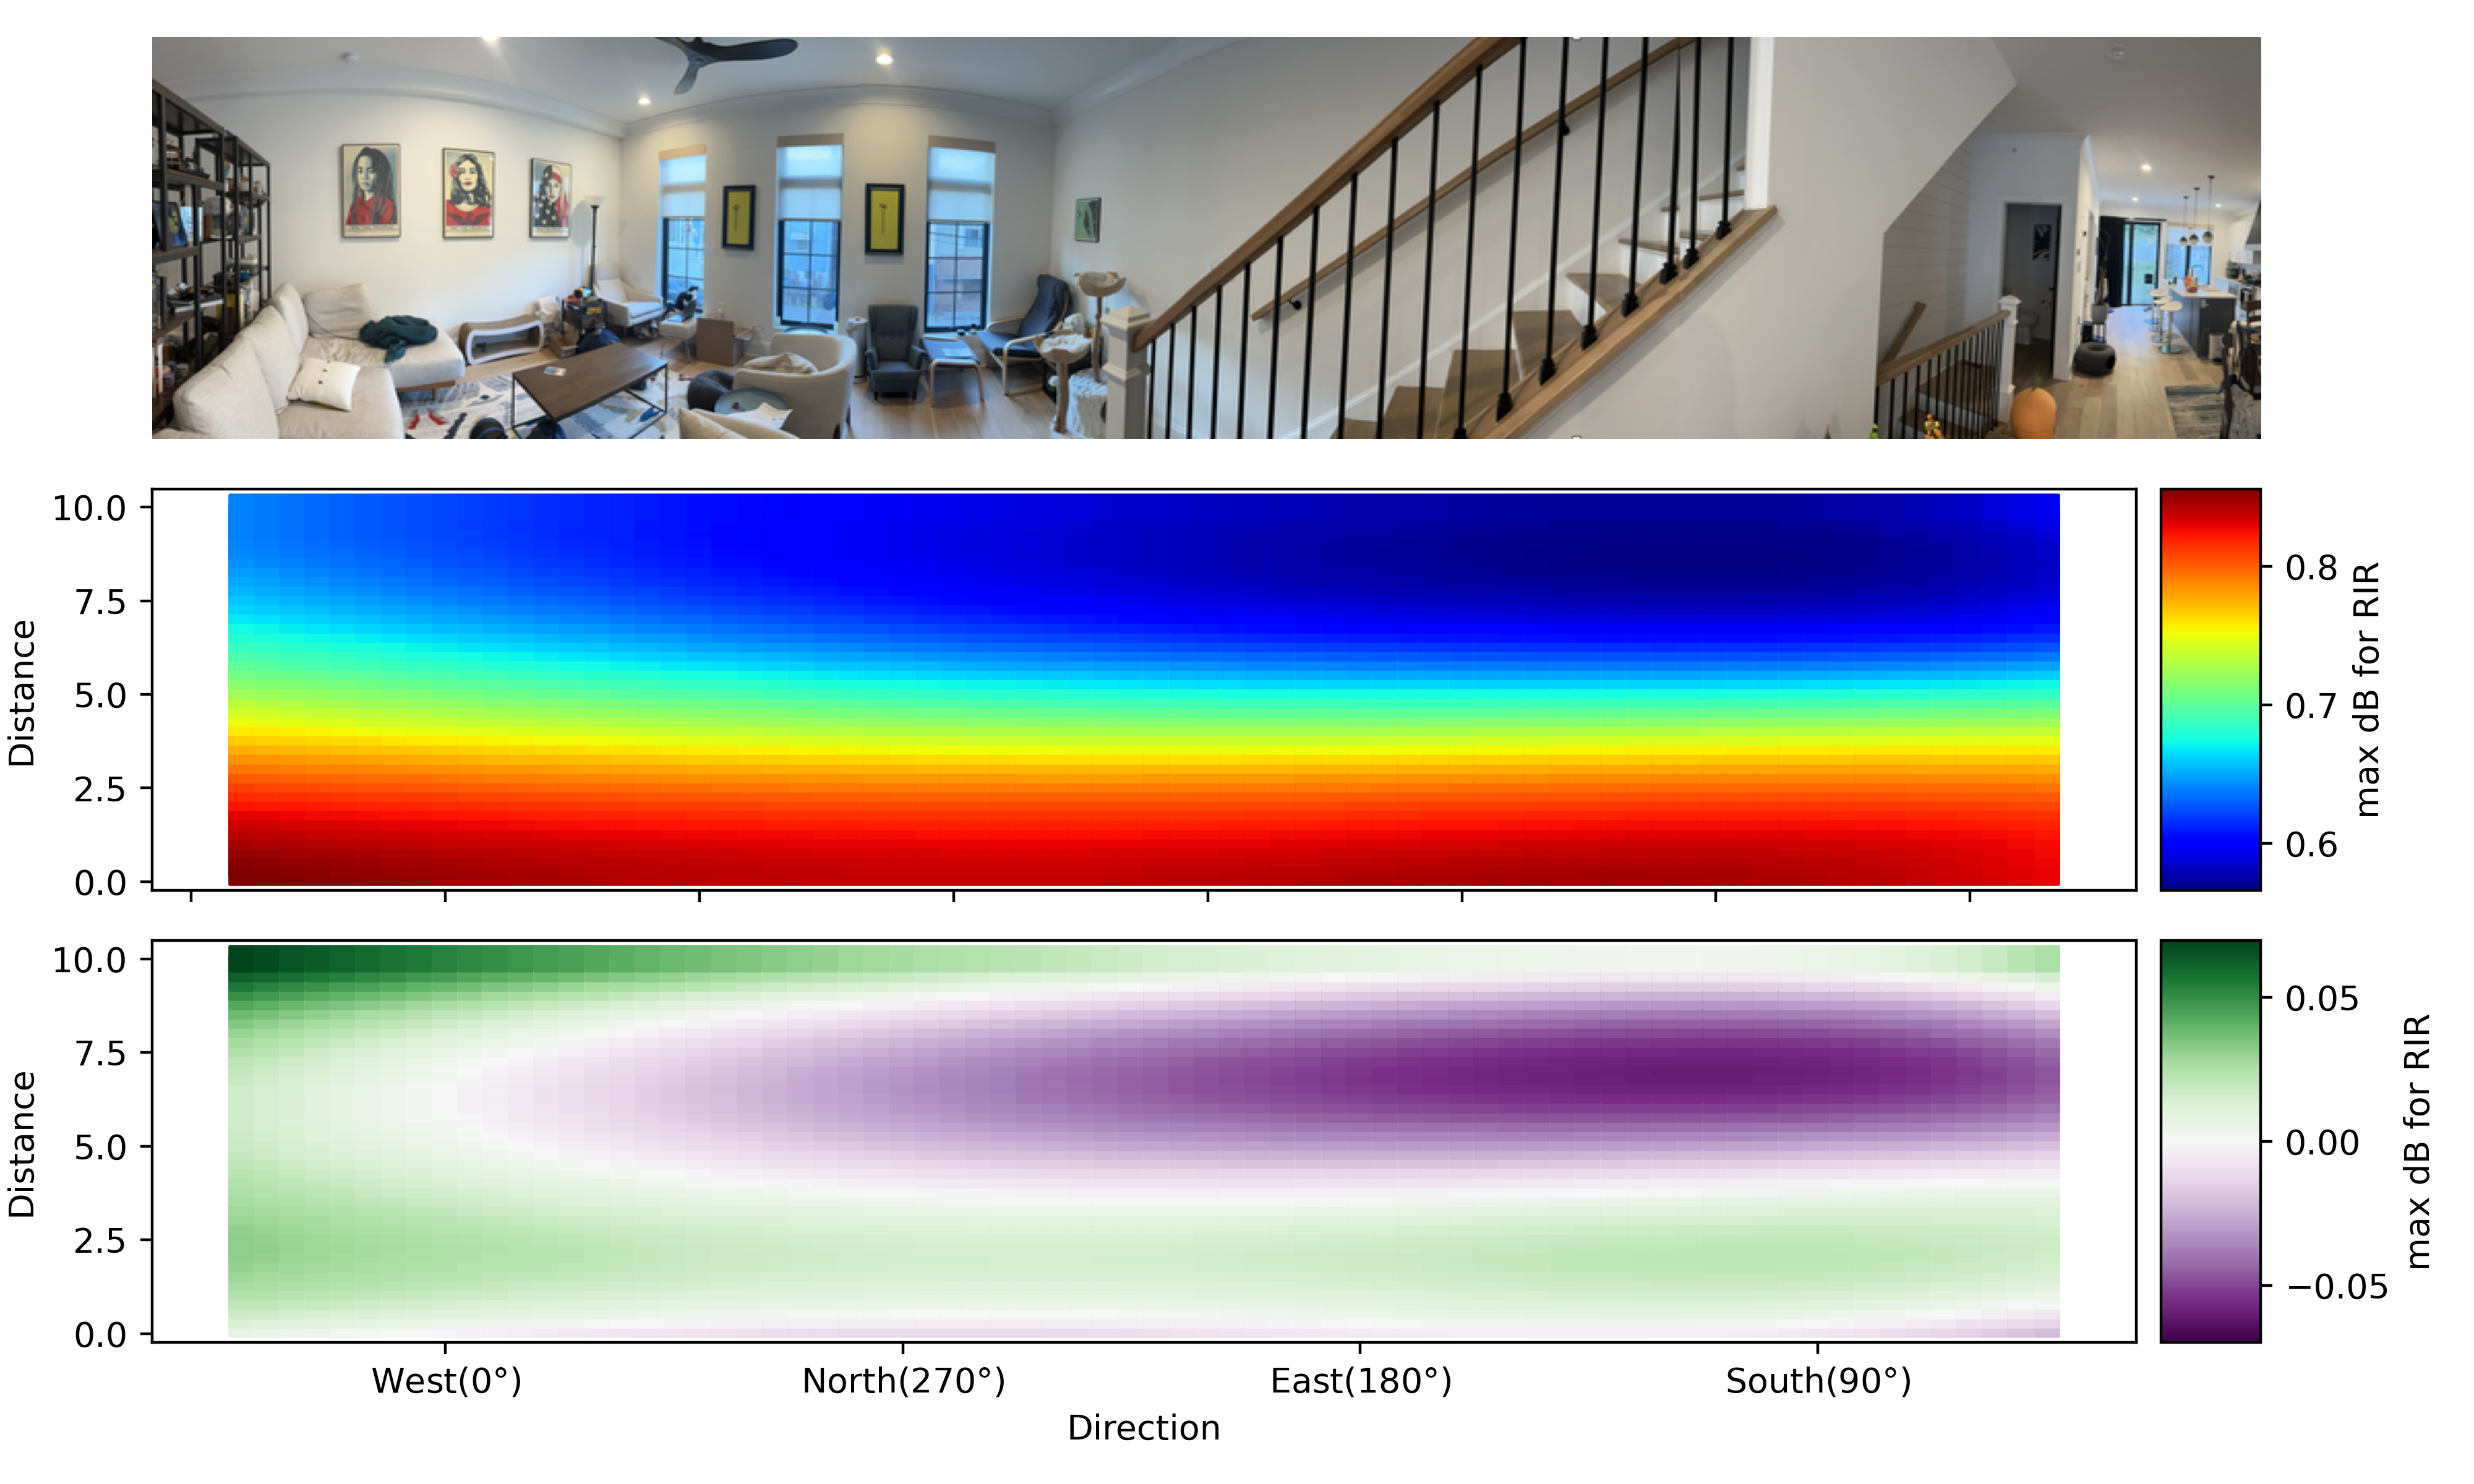
First row shows the real-world panorama. The leftmost and rightmost edges correspond to 45°, and we change angles in clockwise direction from left-to-right.
The reason for non-increasing order of angles on x-axis is that panorama's are taken left-to-right, that is, clockwise, whereas angles are measured anti-clockwise.
Note that the cardinal directions indicated on the plots does not imply that the panoramo starting direction and are only for illustration purposes.
Second row shows heatmap plot with the model's prediction for different distance and direction values. The direction is shown on x-axis, covering 360°, and the distances on y-axis range from 0 to 10 meters. Note that the direction is aligned with the visual image, i.e. it starts from -45° to 0, then reduces 270°, 180° 90°, and finally to 45°.
Third row shows the difference from the distance based baseline. Since the distance based baseline doesn't depend on the image, we visualize the variation in our model's prediction from the baseline. Here the green indicates where the model predicts significantly higher normalized max dB values than distance-based linear regression model, and purple indicates significantly lower normalized max dB values than naive baseline. Note that the dB values are normalized from 0 to 1.
BibTeX
@article{jain2024anavi,
  author    = {Jain, Vidhi and Veerapaneni, Rishi and Bisk, Yonatan},
  title     = {ANAVI: Audio Noise Awareness using Visuals of Indoor environments for NAVIgation},
  journal   = {8th Annual Conference on Robot Learning},
  year      = {2024},
}